

What Does Sony Group (6758) Actually Do?
A plain-English map of Sony’s segment engine, how profits are made, and what to track in 20-F filings

Table of Contents
A plain-English explanation of Sony’s business model (IP + devices + sensors + finance)
What does Sony Group (6758) actually do? In plain English, Sony is a diversified global company that earns money from (1) entertainment IP (games, music, film/TV), (2) consumer and professional electronics and services, (3) image sensors used across smartphones and other devices, and (4) a Japan-focused financial services business.
Sony’s filings describe its reportable segments as:
- Game & Network Services (G&NS)
- Music
- Pictures
- Entertainment, Technology & Services (ET&S)
- Imaging & Sensing Solutions (I&SS)
- Financial Services
- All Other
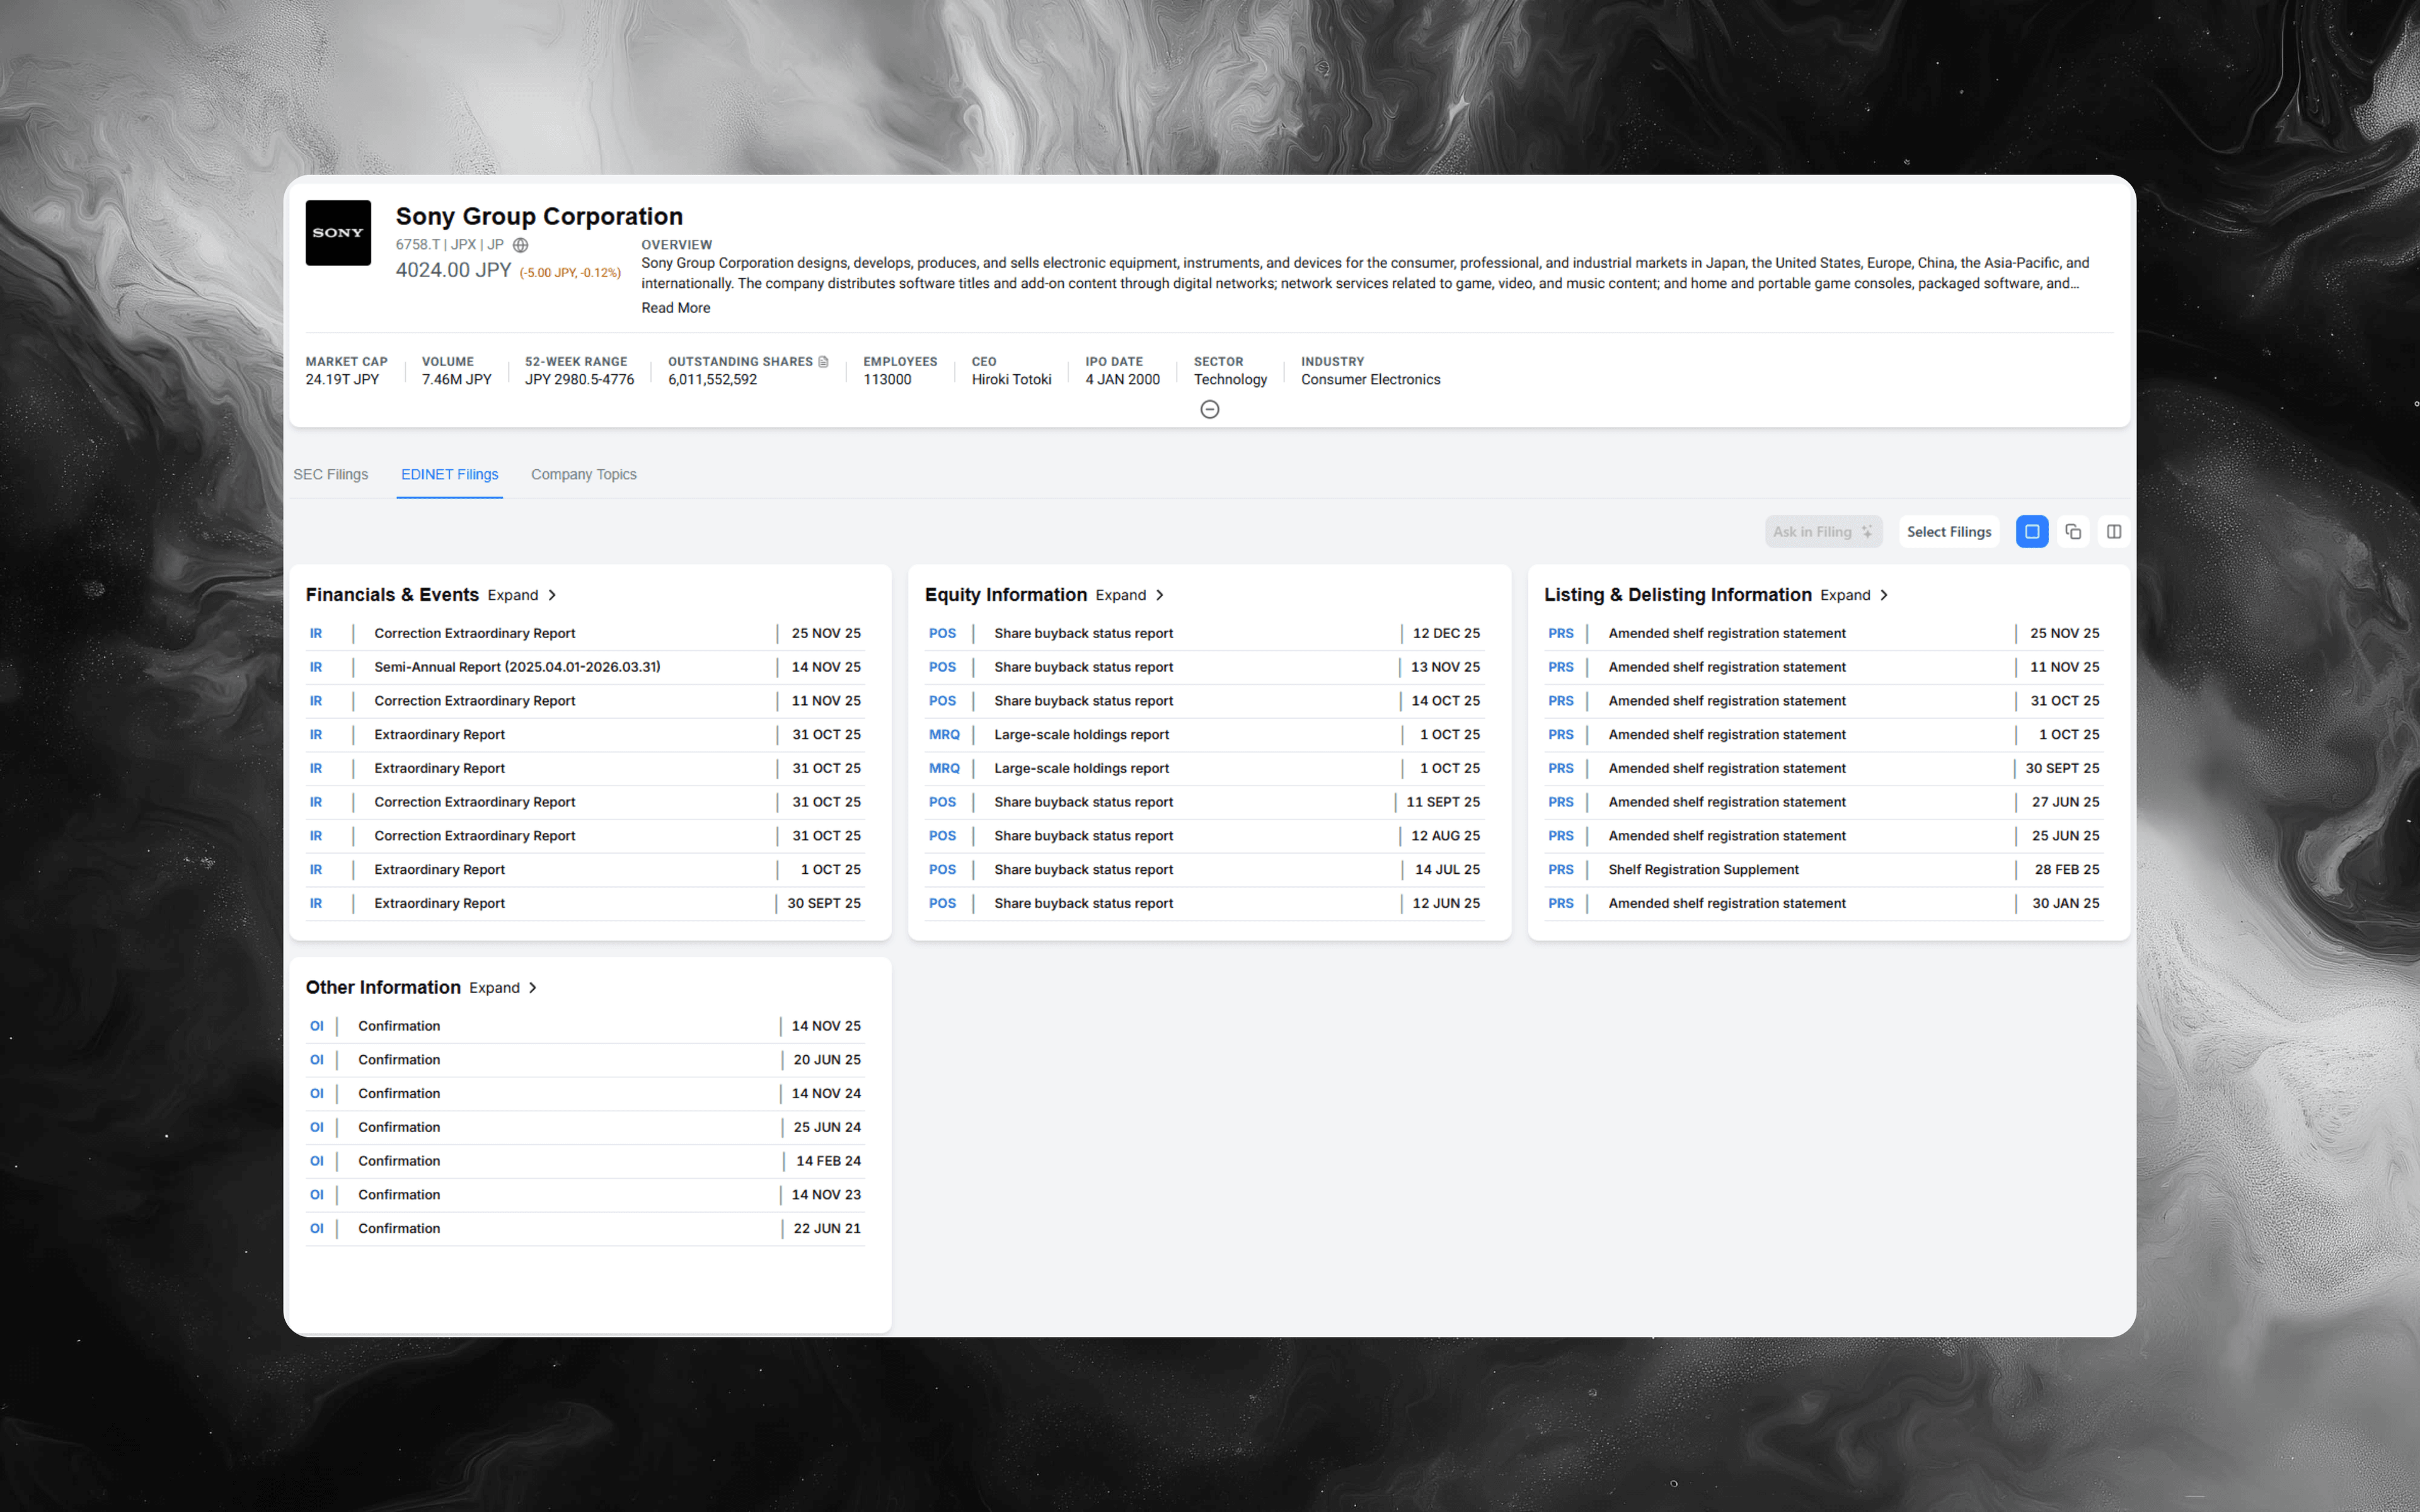
If you want the primary-source foundation (segment definitions, what each segment sells, and how Sony reports segment profit), start with the filings in Alpha Analyst here: Sony Group Corporation (SONY)
The fastest mental model: a portfolio of cash-flow engines with different cycles
Sony can look “complicated” because its segments behave differently across cycles:
- IP-driven businesses (games/music/pictures) tend to be hit-driven but can create long-lived franchises
- Hardware businesses (TV, audio, cameras, smartphones) are exposed to product cycles, pricing, and supply chain execution
- Sensors (I&SS) often behave like a scaled component business, influenced by smartphone demand and customer mix
- Financial services can swing with markets and interest rates, and is analyzed with a different lens than operating segments
A useful analyst habit: don’t try to summarize Sony with one narrative. Instead, track the portfolio mix and what’s driving changes in segment profit.
How Sony makes money (the step-by-step operating loop)
Here’s a practical loop that connects Sony’s products to reported results:
-
Sony invests in IP and platforms
That includes creating and acquiring content, signing artists and publishing rights, producing films/TV, and building game ecosystems. -
Sony distributes through multiple channels
Digital and subscription distribution matters across segments (games, streaming services, music streaming, etc.), and distribution mix influences margins and working capital. -
Sony pairs hardware + software + services where it can
In gaming, hardware can be an entry point to software and network services. In electronics, devices can be linked to services and ecosystems depending on category. -
Sony monetizes scaled components in sensors
I&SS is often easier to analyze like a product-category and customer-demand problem: unit volumes, pricing, yields, and customer concentration/mix. -
Sony also runs a financial services segment
This segment is structurally different: it can be influenced by market levels and interest rates, and it carries risk-management dynamics that don’t mirror consumer electronics or media.
Analyst takeaway: Sony is not “one business.” It’s a set of earnings streams whose correlation can change, which is exactly why segment-level diligence matters.
What Sony sells (in analyst language) by segment
A simple way to map Sony is to translate each segment into what it sells and what typically drives profit:
-
G&NS (Game & Network Services)
Think home gaming products, software and add-on content, and network services. A core question is the mix: recurring network services vs software vs hardware. -
Music
Think recorded music, music publishing, and other music-adjacent businesses described in filings. Key questions tend to involve streaming growth, catalog strength, and margin discipline. -
Pictures
Think motion pictures, television productions, and media networks/DTC services. This segment often has timing effects (release schedules, delivery timing, and content amortization dynamics). -
ET&S (Entertainment, Technology & Services)
Think televisions, audio and video products, still and video cameras, smartphones, and internet-related services. Key drivers often include product mix, premiumization, and cost structure. -
I&SS (Imaging & Sensing Solutions)
Think image sensors. Key drivers often include smartphone demand, customer/product mix, utilization, and investment pace. -
Financial Services
Primarily life and non-life insurance and banking in Japan (as described in filings). Key drivers can include market impacts and interest rate conditions, plus product demand and asset-liability management considerations.
Analysts mapping major global conglomerates may find it useful to compare this Sony breakdown with plain-English guides for other diversified companies—see What Does Apple (AAPL) Actually Do?, What Does Alphabet (GOOG) Actually Do?, or What Does Amazon (AMZN) Actually Do?.
The few “cross-cutting” variables that can move multiple segments
Sony’s segments are different, but a handful of variables can affect several at once:
-
Foreign exchange rates
Sony reports in yen and operates globally, so FX can change the translated revenue/profit profile across multiple segments. -
Content timing and amortization
For IP-heavy businesses, timing of releases, deliveries, and content cost recognition can cause quarter-to-quarter noise. -
Consumer demand and pricing pressure
Electronics categories can be sensitive to macro demand and competitive pricing. -
Platform health and engagement (especially in gaming)
Engagement and monetization dynamics can matter as much as unit sales. -
Investment intensity
Sensors capacity/investment, content spend, and R&D priorities can shift the margin profile even if revenue is stable.
How to read Sony’s 20-F like an analyst (a repeatable checklist)
Use this checklist each filing cycle to keep your work consistent:
-
Start with segment definitions, then map changes
Sony explicitly defines what’s inside each reportable segment. If you don’t anchor on those definitions, it’s easy to misread drivers. -
Build a segment “bridge” before you read management commentary
Create a simple table in your notes:- Segment revenue (or sales/financial services revenue)
- Segment profit
- What changed vs last period Then use the narrative only to explain the numbers, not replace them.
-
Separate IP economics from hardware economics
Ask yourself: is this change driven by engagement/monetization and content performance, or by unit volumes, pricing, and costs? The analysis framework is different. -
Treat Financial Services as its own model
Don’t blend it casually into “operating margin.” Keep it as a separate lens with its own drivers (market impacts, interest rate sensitivity, and segment-specific risks). -
Watch for resegmenting and “restated” comparatives
Diversified companies sometimes rename segments or shift business lines. Track when comparatives are restated so you don’t attribute changes to “performance” that are actually presentation shifts.
For a practical workflow on analyzing filings for complex, multi-segment businesses, see One-Click 10-K & 10-Q Financials to Excel.
High-signal keywords to search in Sony filings
If you want a repeatable workflow, run a consistent keyword set every period and compare what changed in language and emphasis:
- “segment” NEAR “operating income” (or “segment profit” / “segment profit (loss)”)
- “Game & Network Services” OR “G&NS”
- “Music Publishing” OR “Recorded Music”
- “Motion Pictures” OR “Television Productions” OR “Media Networks”
- “Entertainment, Technology & Services” OR “ET&S”
- “image sensors” OR “Imaging & Sensing Solutions” OR “I&SS”
- “financial services revenue” OR “insurance” OR “banking”
- “foreign exchange” OR “yen” OR “currency”
- “content” NEAR “amortization” OR “impairment”
- “risk” NEAR “interest rates” (especially for Financial Services)
In Alpha Analyst, phrase matching and proximity operators can keep these searches focused so you get the passages that explain what changed, not every generic mention.
How to do Sony research faster in Alpha Analyst
If you cover Sony repeatedly, your goal is to turn “filing reading” into a system that runs each quarter:
-
Save your Sony segment searches once, then reuse them
Build a saved-search pack for each segment (G&NS, Music, Pictures, ET&S, I&SS, Financial Services) plus cross-cutting topics (FX, content amortization, risk factors). Reuse the same set every cycle. -
Pin those saved searches to a dashboard
Create a Sony monitoring workspace with Recent Filings plus your saved keyword searches filtered to Sony, so new disclosures surface immediately when filings are published. -
Use AI Chat to translate segment language into decision-ready notes
Examples prompts:- “Summarize what changed in G&NS this period and list the cited passages.”
- “Where does Sony explain I&SS demand drivers and capacity/investment implications?”
- “What are the key Financial Services sensitivities mentioned in the risk discussion?”
Keep the document universe constrained to the exact filing(s) you’re reviewing to stay grounded.
-
Annotate the passages you’ll want next quarter
Highlight the few lines that explain the inflection points (mix shifts, pricing pressure, investment changes, content timing). Centralized annotations make your next update faster and more auditable.
For further efficiency in researching large-cap names and segment drivers, review AI Search for SEC Filings, Rebuilt From the Ground Up.
Explore Sony filings in Alpha Analyst
When your goal is to understand how Sony’s portfolio actually works, the fastest path is to read it the way the company reports it: by segment definitions, segment profit, and what changed in risks and assumptions.
Go straight to the primary-source filings here: Sony Group Corporation (SONY)
CTA: Use Alpha Analyst to save a Sony segment-search pack, pin it to a dashboard, and let new Sony disclosures surface automatically each filing cycle—so you spend less time hunting and more time forming a view.
Related Posts
View all posts →
January 16, 2026
Amgen (AMGN) Deep Dive: Products, Pipeline, and Key Risks
A practical equity-research playbook for underwriting the next leg of growth, margin durability, and biosimilar exposure

January 16, 2026
Daikin Industries (6367): A Deep-Dive Equity Research Playbook
Business model, segment drivers, key risks, and how to build a thesis faster in Alpha Analyst

January 16, 2026
Bridgestone (5108): Deep Dive on Segments, Strategy, and Risks
A fundamentals-first breakdown of how the tire leader makes money, what’s changing in 2024–2026, and what to monitor next

January 16, 2026
Panasonic (6752) Deep Dive: Segments, Strategy, and Key Watch Items
A filing-driven look at Panasonic Holdings’ business mix, portfolio moves, and the debates that matter for investors

January 16, 2026
Gilead Sciences (GILD) Deep Dive: Business, Moats, and Key Risks
A practical investor framework for underwriting Gilead’s HIV-led cash flows, oncology optionality, and policy-driven headwinds
Explore More
View all posts →
February 4, 2026
Software Stocks and AI Disruption Fears: Investor Playbook
How to evaluate “AI risk” claims, pressure-test seat-based pricing, and track what matters in filings using Alpha Analyst

February 4, 2026
Enphase (ENPH) Upgrade After Earnings: What Changed
A practical investor brief on the BMO upgrade, Q4 beat, 2026 guideposts, and how to track follow-through in Alpha Analyst

February 4, 2026
Tether fundraising report: what changed and how to track it
A practical framework for monitoring stablecoin issuer valuation, liquidity, and regulatory signals with Alpha Analyst