

What Does Citigroup (C) Actually Do?
A plain-English map of Citi’s profit engines, how a global bank makes money, and what to track in 10-K/10-Q filings

Table of Contents
A plain-English explanation of Citigroup’s business model (spreads + fees + scale)
What does Citigroup (C) actually do? In plain English, Citi is a global bank that earns money through two big mechanisms:
- Spread income: borrowing money (largely via deposits and wholesale funding) and lending/investing it at higher rates
- Fee income: charging for payments, custody, treasury services, trading and underwriting, wealth advisory, card fees, and other services
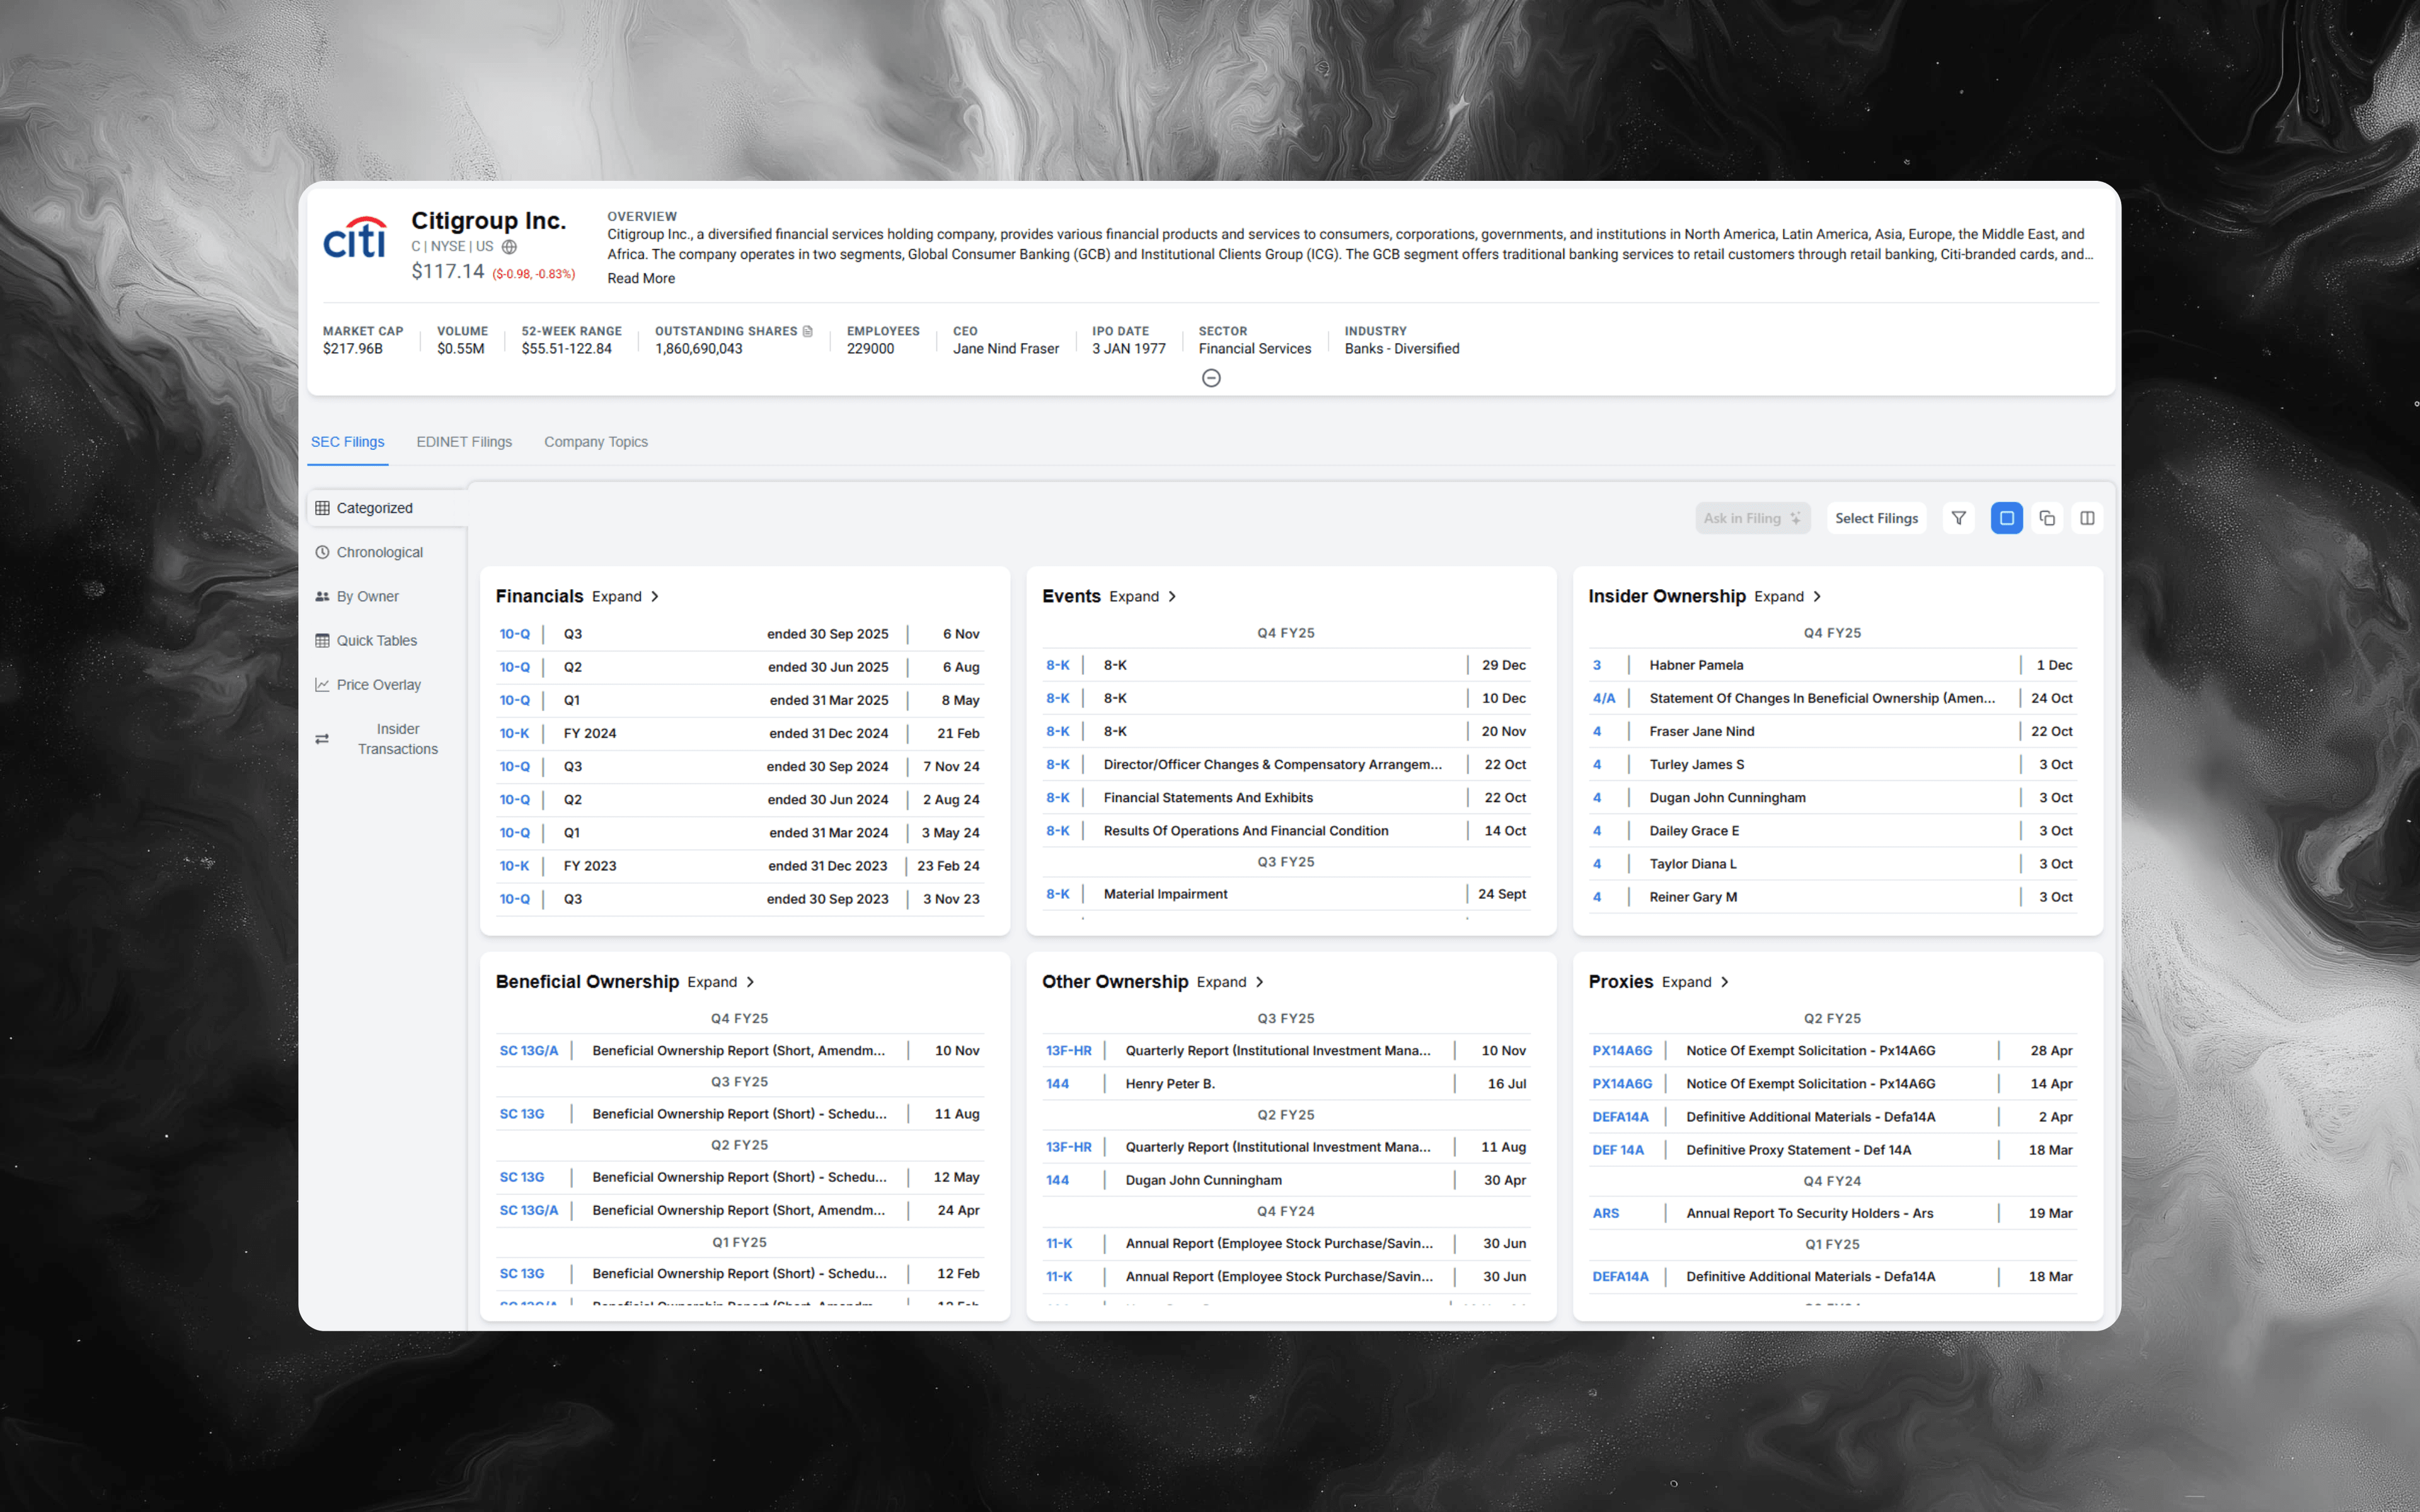
The most reliable starting point is always Citi’s segment reporting and how it reconciles segment results to consolidated results. In Alpha Analyst, you can start with primary-source filings here: Citigroup Inc. (C)
The fastest mental model: two client universes, one balance sheet
Citi can look complex because it serves very different customers with shared infrastructure:
- Institutional clients: corporates, financial institutions, governments, investors
- Consumer and wealth clients: households, affluent/high-net-worth clients, cardholders and borrowers
Both sides run through the same core constraints: capital, liquidity, funding mix, credit risk, market risk, and regulatory requirements. The key analyst habit is to avoid “bank storytelling” and instead anchor on the mechanics: what balance sheet is being used, what risk is being taken, and what fee lines are being scaled.
How Citi makes money (the step-by-step operating loop)
A practical loop that ties Citi’s activities to what you see in filings:
-
Acquire and retain funding
Deposits matter because they can be a lower-cost, more stable funding source than wholesale markets. Watch deposit mix and deposit betas (how quickly deposit costs reprice). -
Allocate the balance sheet
Citi deploys funds into loans, securities, and other earning assets. The mix affects net interest income and the risk profile. -
Sell “pipes and plumbing” to institutions
Global banks can generate recurring fee streams from moving money, managing liquidity, and providing custody/administration services. These businesses often scale with client activity and balances. -
Intermediate risk in markets and banking
Trading and underwriting/advisory businesses can generate fees and trading revenue but are more sensitive to market activity, volatility, and issuance cycles. -
Serve consumer and wealth needs
Cards, retail banking, and wealth advisory can produce a blend of interest income and fees. They also introduce credit-cycle sensitivity (charge-offs, provisions). -
Absorb credit costs and operating expense
The income statement is not just “revenue.” Credit loss provisions, net charge-offs, legal/regulatory costs, and efficiency investments can drive large swings in profitability.
What to look for in Citi’s segment reporting (without guessing the labels)
Citi’s filings describe its reportable segments and what each segment includes. Even if you don’t memorize the segment names, you can build a durable map by sorting each segment into one of these buckets:
-
Transactional services (payments, treasury, custody-like activities)
Typical drivers: client balances, payment volumes, cross-border flows, rates on operating deposits, fee pricing discipline, retention of large clients -
Markets activity (trading, client execution, financing)
Typical drivers: volatility, client risk appetite, market share, financing spreads, inventory/risk limits, hedge effectiveness -
Corporate and investment banking (advisory, underwriting, lending to corporates)
Typical drivers: deal flow, issuance windows, underwriting fees, credit quality of corporate loan books, concentration risk -
Consumer lending (cards, retail loans where applicable)
Typical drivers: purchase volumes, revolve rates, delinquencies, charge-offs, loan growth vs underwriting standards, funding costs -
Wealth and private bank style businesses (advice + lending + deposits)
Typical drivers: assets under management, net new money, market levels, advisor productivity, lending growth, margin mix between fees and spreads
Your job each quarter is to translate Citi’s segment tables into those economic “buckets,” then explain what changed and why.
The cross-cutting variables that move multiple Citi lines at once
For a global bank, a few variables can ripple through many segments at the same time:
-
Interest rates and the yield curve
Impacts net interest income, deposit costs, securities marks (depending on classification), and client behavior. -
Deposit mix and funding costs
Watch the composition (consumer vs institutional, insured vs uninsured, operating vs rate-sensitive) and how quickly costs reprice. -
Credit cycle and reserve builds/releases
Provisions can overwhelm operating momentum. Track what management says about macro assumptions and portfolio performance. -
Markets activity and issuance windows
Trading performance and investment banking fees can be cyclical and sensitive to volatility, risk appetite, and corporate confidence. -
Regulatory and capital constraints
Capital requirements, stress testing outcomes, and resolution/liquidity frameworks shape how much balance sheet Citi can deploy and where. -
Expense trajectory
Global banks run multi-year technology, risk/control, and simplification programs. Track whether expenses are structurally improving or being reinvested.
How to read Citi’s 10-K/10-Q like an analyst (repeatable checklist)
Use the same checklist every filing cycle so your conclusions are comparable:
-
Start with the segment tables, not the letter to shareholders
Build a simple bridge for each segment:- revenue lines (interest and non-interest where shown)
- pre-provision profit (if provided) and/or segment income
- key balance sheet metrics (loans, deposits, average balances) where disclosed
-
Separate “rates-driven” from “volume-driven” changes
Ask: Did spreads move (pricing/funding) or did balances move (growth/mix)? Banks can show strong revenue growth that is purely rate-driven and reversible. -
Treat credit costs as the swing factor
Pair revenue trends with credit indicators (delinquencies, net charge-offs, reserve commentary). The business can look “fine” operationally while the credit cycle is turning. -
Don’t mix volatile fee lines with recurring fee lines
Transactional services and asset-based fees behave differently than underwriting/advisory fees or certain market-driven lines. -
Reconcile segment results to consolidated results
The reconciliation (including corporate/other items) is where you often find costs, hedging impacts, or items that otherwise distort a segment-only view.
High-signal keywords to search in Citi filings
Run the same keyword pack each quarter and compare what changed:
- “reportable segments” OR “segment” NEAR “revenues”
- “net interest income” OR “net interest margin”
- “deposits” NEAR “cost” OR “beta”
- “allowance for credit losses” OR “provision for credit losses”
- “net charge-offs” OR “delinquencies”
- “trading” NEAR “revenue” OR “client”
- “investment banking” OR “underwriting” OR “advisory”
- “liquidity” OR “HQLA” OR “funding”
- “capital” NEAR “CET1” OR “stress”
- “operating expenses” OR “efficiency” OR “transformation”
In Alpha Analyst, keyword operators (phrases, AND/OR/NOT, proximity/NEAR, parentheses) help you surface the passages that explain the change, not every generic mention.
If you’re interested in comparative guides to diversified banks or global financial institutions, see What Does Wells Fargo (WFC) Actually Do?, What Does Bank of America (BAC) Actually Do?, or What Does Mitsubishi UFJ Financial Group (8306) Actually Do?.
How to do Citi research faster in Alpha Analyst
If you cover Citi repeatedly, the goal is to turn filing review into a repeatable system:
-
Save a segment-and-drivers search pack once
Build searches for: segment definitions, NII/NIM, deposits, credit losses, markets activity, investment banking, capital/liquidity, and expenses. Save them and reuse them each filing cycle. -
Pin the pack to a Citi dashboard
Create a monitoring workspace with Recent Filings plus your saved searches filtered to Citi, so new disclosures appear as soon as they’re filed. -
Use AI Chat to convert dense banking language into decision-ready notes
Example prompts:- “Summarize what changed in Citi’s segment results this quarter and list the cited passages.”
- “What did Citi say about deposit costs, deposit mix, and NIM drivers in this filing?”
- “Where does Citi explain reserve changes and credit performance by portfolio?”
-
Annotate the few lines you’ll want next quarter
Highlight the sentences that explain the real driver (deposit repricing, credit normalization, issuance recovery, expense run-rate). Next quarter, your work starts from your own prior notes, not from scratch.
For a practical workflow on analyzing filings for large, multi-segment banks and exporting financials, you may want to review One-Click 10-K & 10-Q Financials to Excel.
Explore Citigroup filings in Alpha Analyst
If your goal is to understand what Citi actually does, the fastest path is to read it the way the company reports it: segment definitions, key balance sheet drivers, credit costs, and capital constraints.
Go straight to Citi’s filings here: Citigroup Inc. (C)
CTA: Use Alpha Analyst to save a Citi keyword pack (segments, NII, deposits, credit, capital), pin it to a dashboard, and let each new filing update your research automatically—so you spend less time searching and more time forming a view.
Related Posts
View all posts →
January 31, 2026
Fed Chair Nomination News: What Hassett’s Comments Signal
A practical guide to tracking Fed leadership changes, confirmation risk, and market reactions using filings, search, and dashboards

January 29, 2026
New York Fiscal Crisis: A Company Impact Playbook
How to map NYC budget stress to revenue, taxes, real estate, and credit risk across US equities

January 29, 2026
Monetary Debasement and the US Dollar: A Company Playbook
What “currency going to hell” really means, what could come next for USD, and how US businesses can defend margins, cash flows, and valuation

January 16, 2026
Amgen (AMGN) Deep Dive: Products, Pipeline, and Key Risks
A practical equity-research playbook for underwriting the next leg of growth, margin durability, and biosimilar exposure

January 16, 2026
Daikin Industries (6367): A Deep-Dive Equity Research Playbook
Business model, segment drivers, key risks, and how to build a thesis faster in Alpha Analyst
Explore More
View all posts →
February 4, 2026
Software Stocks and AI Disruption Fears: Investor Playbook
How to evaluate “AI risk” claims, pressure-test seat-based pricing, and track what matters in filings using Alpha Analyst

February 4, 2026
Enphase (ENPH) Upgrade After Earnings: What Changed
A practical investor brief on the BMO upgrade, Q4 beat, 2026 guideposts, and how to track follow-through in Alpha Analyst

February 4, 2026
Tether fundraising report: what changed and how to track it
A practical framework for monitoring stablecoin issuer valuation, liquidity, and regulatory signals with Alpha Analyst