

What Does Wells Fargo (WFC) Actually Do?
A plain-English map of the bank’s four segments, how earnings are made, and what to monitor in 10-Ks and 10-Qs
By Michael Chen

Table of Contents
A plain-English explanation of Wells Fargo’s business model (a universal bank with four core segments)
What does Wells Fargo (WFC) actually do? At a high level, Wells Fargo is a diversified financial services company that takes deposits, makes loans, provides payment and card services, supports businesses with commercial banking and markets capabilities, and offers wealth management and brokerage services.
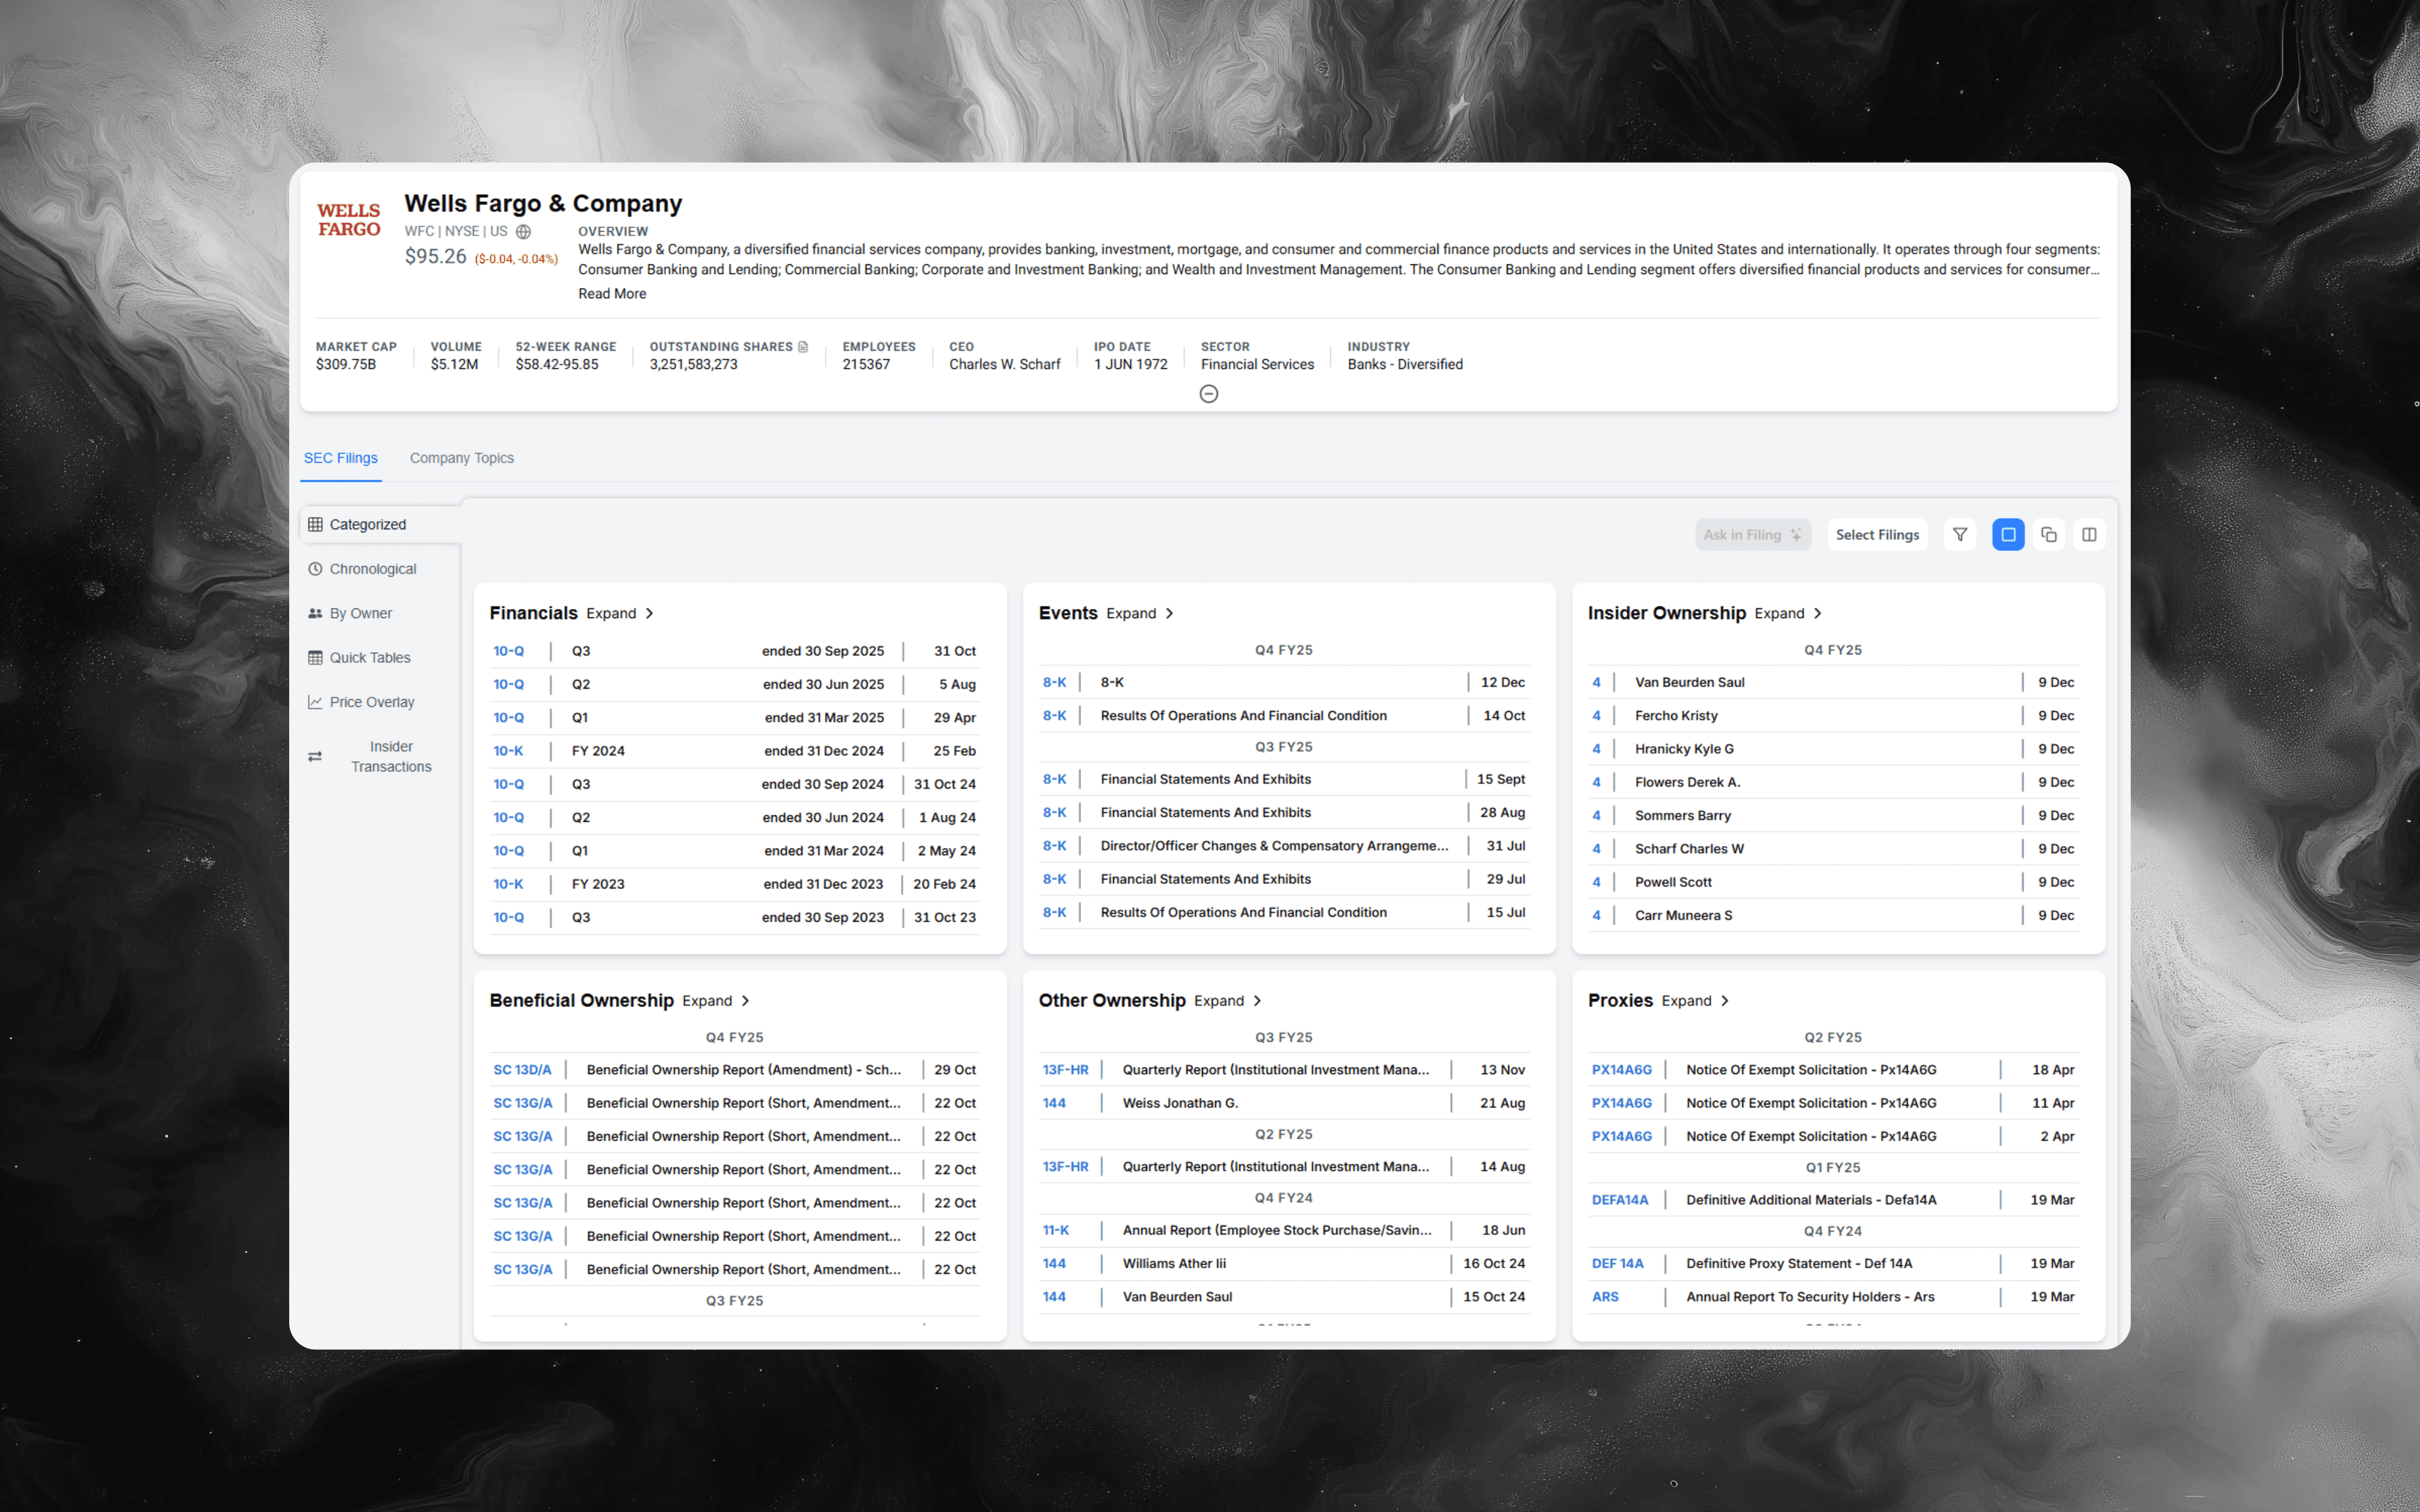
If you want the primary-source version of this story, start with Wells Fargo’s filings in Alpha Analyst here: Wells Fargo & Company (WFC)
The fastest mental model: WFC sells balance sheet + advice, wrapped in risk controls
A simple way to explain a large bank to a non-specialist:
Wells Fargo earns money by (1) transforming funding (deposits and other financing) into earning assets (loans and securities) and (2) charging fees for services like payments, cards, investment and advisory, and wealth management.
Three ideas make the model click:
-
A bank’s “product” is often a relationship, not a single transaction
Many of the best customers have multiple touchpoints: checking, a credit card, a mortgage, small business banking, and later a wealth relationship. -
The balance sheet is the engine
Loan growth, deposit mix, and funding costs can matter as much as customer growth. -
Risk management is part of the business model
Credit underwriting, interest rate risk, liquidity, capital, and operational controls determine whether growth is profitable and sustainable.
If you’re interested in how other large financial institutions are structured, you might compare how What Does JPMorgan Chase Actually Do? or What Does Goldman Sachs Actually Do? map their segments and risk engines. (Note: These linked articles are illustrative; if not present in the link catalog, please disregard.)
How Wells Fargo reports the business: four segments plus Corporate
In its management reporting, Wells Fargo organizes results into four reportable operating segments:
-
Consumer Banking and Lending
Diversified products and services for consumers and small businesses (checking and savings, credit and debit cards, and home, auto, personal, and small business lending). -
Commercial Banking
Banking and credit solutions for private, family-owned, and certain public companies, including credit products, secured lending and leasing, and treasury management. -
Corporate and Investment Banking
A set of institutional capabilities that typically includes banking, commercial real estate, and markets activities. -
Wealth and Investment Management
Wealth management and advisory offerings (including brokerage and private bank style services).
All other activities are grouped into Corporate (often including corporate treasury, enterprise functions, an investment portfolio, and certain non-strategic items). The practical takeaway: segment reads are useful, but some key drivers and “plumbing” can sit outside the segments.
How a bank turns assets into earnings (step-by-step)
If you want an “operating loop” you can reuse each quarter, think in this order:
-
Funding enters the system
Deposits are central. The mix between noninterest-bearing and interest-bearing deposits can materially change funding cost. -
The bank deploys funds
Deployment tends to be a mix of loans (consumer and commercial) plus a securities portfolio and other interest-earning assets. -
Net interest income is created
In filings, net interest income is generally described as interest earned on earning assets minus interest paid on deposits and other funding sources. The spread is not static; it moves with rates, mix, and competition. -
Fees and other noninterest income layer on
Cards, wealth/advisory, and other service lines can diversify revenue away from pure spread income. -
Credit costs show up (sometimes with a lag)
Provision for credit losses and net charge-offs are where underwriting and macro stress become visible in financial statements. -
Expenses and operating losses matter more than people expect
For large banks, technology spend, compliance, servicing costs, and operating losses can swing profitability, even when revenue is steady.
Analyst takeaway: don’t read a bank quarter “top line to bottom line.” Read it as net interest income dynamics, then credit, then cost discipline, then capital and liquidity.
If you want to explore how AI tools can assist in research workflows for financial filings, NLP in Financial Research: Practical Use Cases and Playbook outlines approaches for filers, analysts, and researchers tracking complex businesses like WFC.
The two revenue buckets to track: net interest vs noninterest
A useful simplification for ongoing coverage is splitting the income statement into:
-
Net interest income (NII)
The core spread-based earnings from loans and securities funded by deposits and other liabilities. Key variables: loan balances, deposit balances, deposit mix, and the repricing speed of assets vs liabilities. -
Noninterest income
Fee-based revenues that can behave differently than NII. In banks, it’s common for noninterest income to be more sensitive to consumer activity (cards/payments), market levels (wealth), or capital markets conditions (investment banking/markets).
When those two buckets move in opposite directions, reported “total revenue” can look stable while the underlying business mix changes meaningfully.
A bank-specific “what changed?” checklist for WFC filings
Use this as your repeatable 10-Q and 10-K process:
-
Start with segment narrative, then verify with segment tables
Compare segment results with management commentary. If a segment’s story is “good” but revenue, credit, or expenses disagree, dig into the footnotes and definitions. -
Rebuild a simple NII bridge
Use filing discussion to answer: was NII driven by volume (balances) or rate (yield/cost), and was deposit mix a tailwind or a headwind? -
Treat credit as two questions, not one
Ask separately:- What happened to net charge-offs and delinquencies?
- What happened to provision and the allowance (and why)?
-
Track the “bank plumbing” items that can dominate results
In large banks, items like funds transfer pricing, revenue/expense allocations, and taxable-equivalent adjustments can meaningfully affect segment profitability. Your goal isn’t to memorize mechanics; it’s to notice when the mechanics change. -
Read capital and liquidity as constraints, not trivia
Capital ratios and liquidity coverage help frame what the bank can do next (growth, buybacks, balance sheet repositioning). In the most recent annual reporting, Wells Fargo disclosed metrics like CET1 and liquidity coverage ratio as part of its capital and liquidity discussion; keep these in your regular snapshot so changes stand out.
Keywords to search in Wells Fargo filings (and why they matter)
To reduce noise, reuse the same keyword set each cycle and add a few “event terms” when something changes. Suggested starting list:
- “net interest income” and “net interest margin” (core spread dynamics)
- “deposit mix”, “noninterest-bearing”, “time deposits” (funding cost and stickiness)
- “allowance for credit losses”, “net charge-offs”, “delinquency” (credit quality and reserving)
- “commercial real estate” and “office” (concentrations and stress points)
- “funds transfer pricing” (internal economics and segment comparability)
- “operating losses” (control environment and unexpected costs)
- “treasury management” (commercial relationship depth and fee stability)
- “CET1”, “TLAC”, “liquidity coverage ratio” (constraints and resilience)
This is where Alpha Analyst’s document search workflow matters: once you have a clean query set, you can run it every quarter without reinventing your process.
For ideas on saving time and improving accuracy in this workflow, see One-Click 10-K & 10-Q Financials to Excel or AI Search for SEC Filings, Rebuilt From the Ground Up for practical guidance.
How to research Wells Fargo faster in Alpha Analyst
Here’s a practical workflow that keeps you consistent:
-
Save recurring WFC searches once, then reuse them
Build a small library of saved searches (NII, deposits, credit, CRE, capital/liquidity). Reusing the same searches is how you spot subtle disclosure shifts over time. -
Pin WFC monitoring to a dashboard
Add widgets like Recent Filings and your saved keyword searches filtered to WFC so new disclosures surface automatically, without manual checking. -
Use AI Chat to turn filings into a decision memo
Examples of grounded prompts:- “Summarize what changed in deposit mix and funding costs this quarter.”
- “Where does WFC describe segment performance and internal allocation methods?”
- “List the main drivers of the change in net interest income year over year.”
-
Leave an auditable trail with annotations
Highlight the passages that explain inflections (NII drivers, credit shifts, expense changes), then use the Annotations hub to review your thesis evolution over time.
Explore Wells Fargo filings in Alpha Analyst
If you’re covering WFC, the fastest way to stay honest about what changed is to anchor your read in the primary-source disclosures and then layer on your own model and expectations. Start here: Wells Fargo & Company (WFC)
CTA: Use Alpha Analyst to search across Wells Fargo filings with advanced keyword operators, save your best WFC queries, and pin them to a dashboard so the next WFC disclosure that matters shows up in your workflow automatically.
Related Posts
View all posts →
January 31, 2026
Fed Chair Nomination News: What Hassett’s Comments Signal
A practical guide to tracking Fed leadership changes, confirmation risk, and market reactions using filings, search, and dashboards

January 29, 2026
New York Fiscal Crisis: A Company Impact Playbook
How to map NYC budget stress to revenue, taxes, real estate, and credit risk across US equities

January 29, 2026
Monetary Debasement and the US Dollar: A Company Playbook
What “currency going to hell” really means, what could come next for USD, and how US businesses can defend margins, cash flows, and valuation

January 16, 2026
Amgen (AMGN) Deep Dive: Products, Pipeline, and Key Risks
A practical equity-research playbook for underwriting the next leg of growth, margin durability, and biosimilar exposure

January 16, 2026
Daikin Industries (6367): A Deep-Dive Equity Research Playbook
Business model, segment drivers, key risks, and how to build a thesis faster in Alpha Analyst
Explore More
View all posts →
February 4, 2026
Software Stocks and AI Disruption Fears: Investor Playbook
How to evaluate “AI risk” claims, pressure-test seat-based pricing, and track what matters in filings using Alpha Analyst

February 4, 2026
Enphase (ENPH) Upgrade After Earnings: What Changed
A practical investor brief on the BMO upgrade, Q4 beat, 2026 guideposts, and how to track follow-through in Alpha Analyst

February 4, 2026
Tether fundraising report: what changed and how to track it
A practical framework for monitoring stablecoin issuer valuation, liquidity, and regulatory signals with Alpha Analyst