

What Does MUFG (8306) Actually Do?
A plain-English map of Mitsubishi UFJ Financial Group’s banking engine, where earnings come from, and what to track in filings

Table of Contents
A plain-English explanation of MUFG’s business model (banking spread + fee businesses)
What does MUFG (8306) actually do? At a high level, Mitsubishi UFJ Financial Group is a diversified financial group whose core economics look like many large banks: gather funding (especially deposits), deploy it into loans and securities, earn net interest income (the spread), add fee income from financial services, and manage credit, rates, liquidity, and capital constraints.
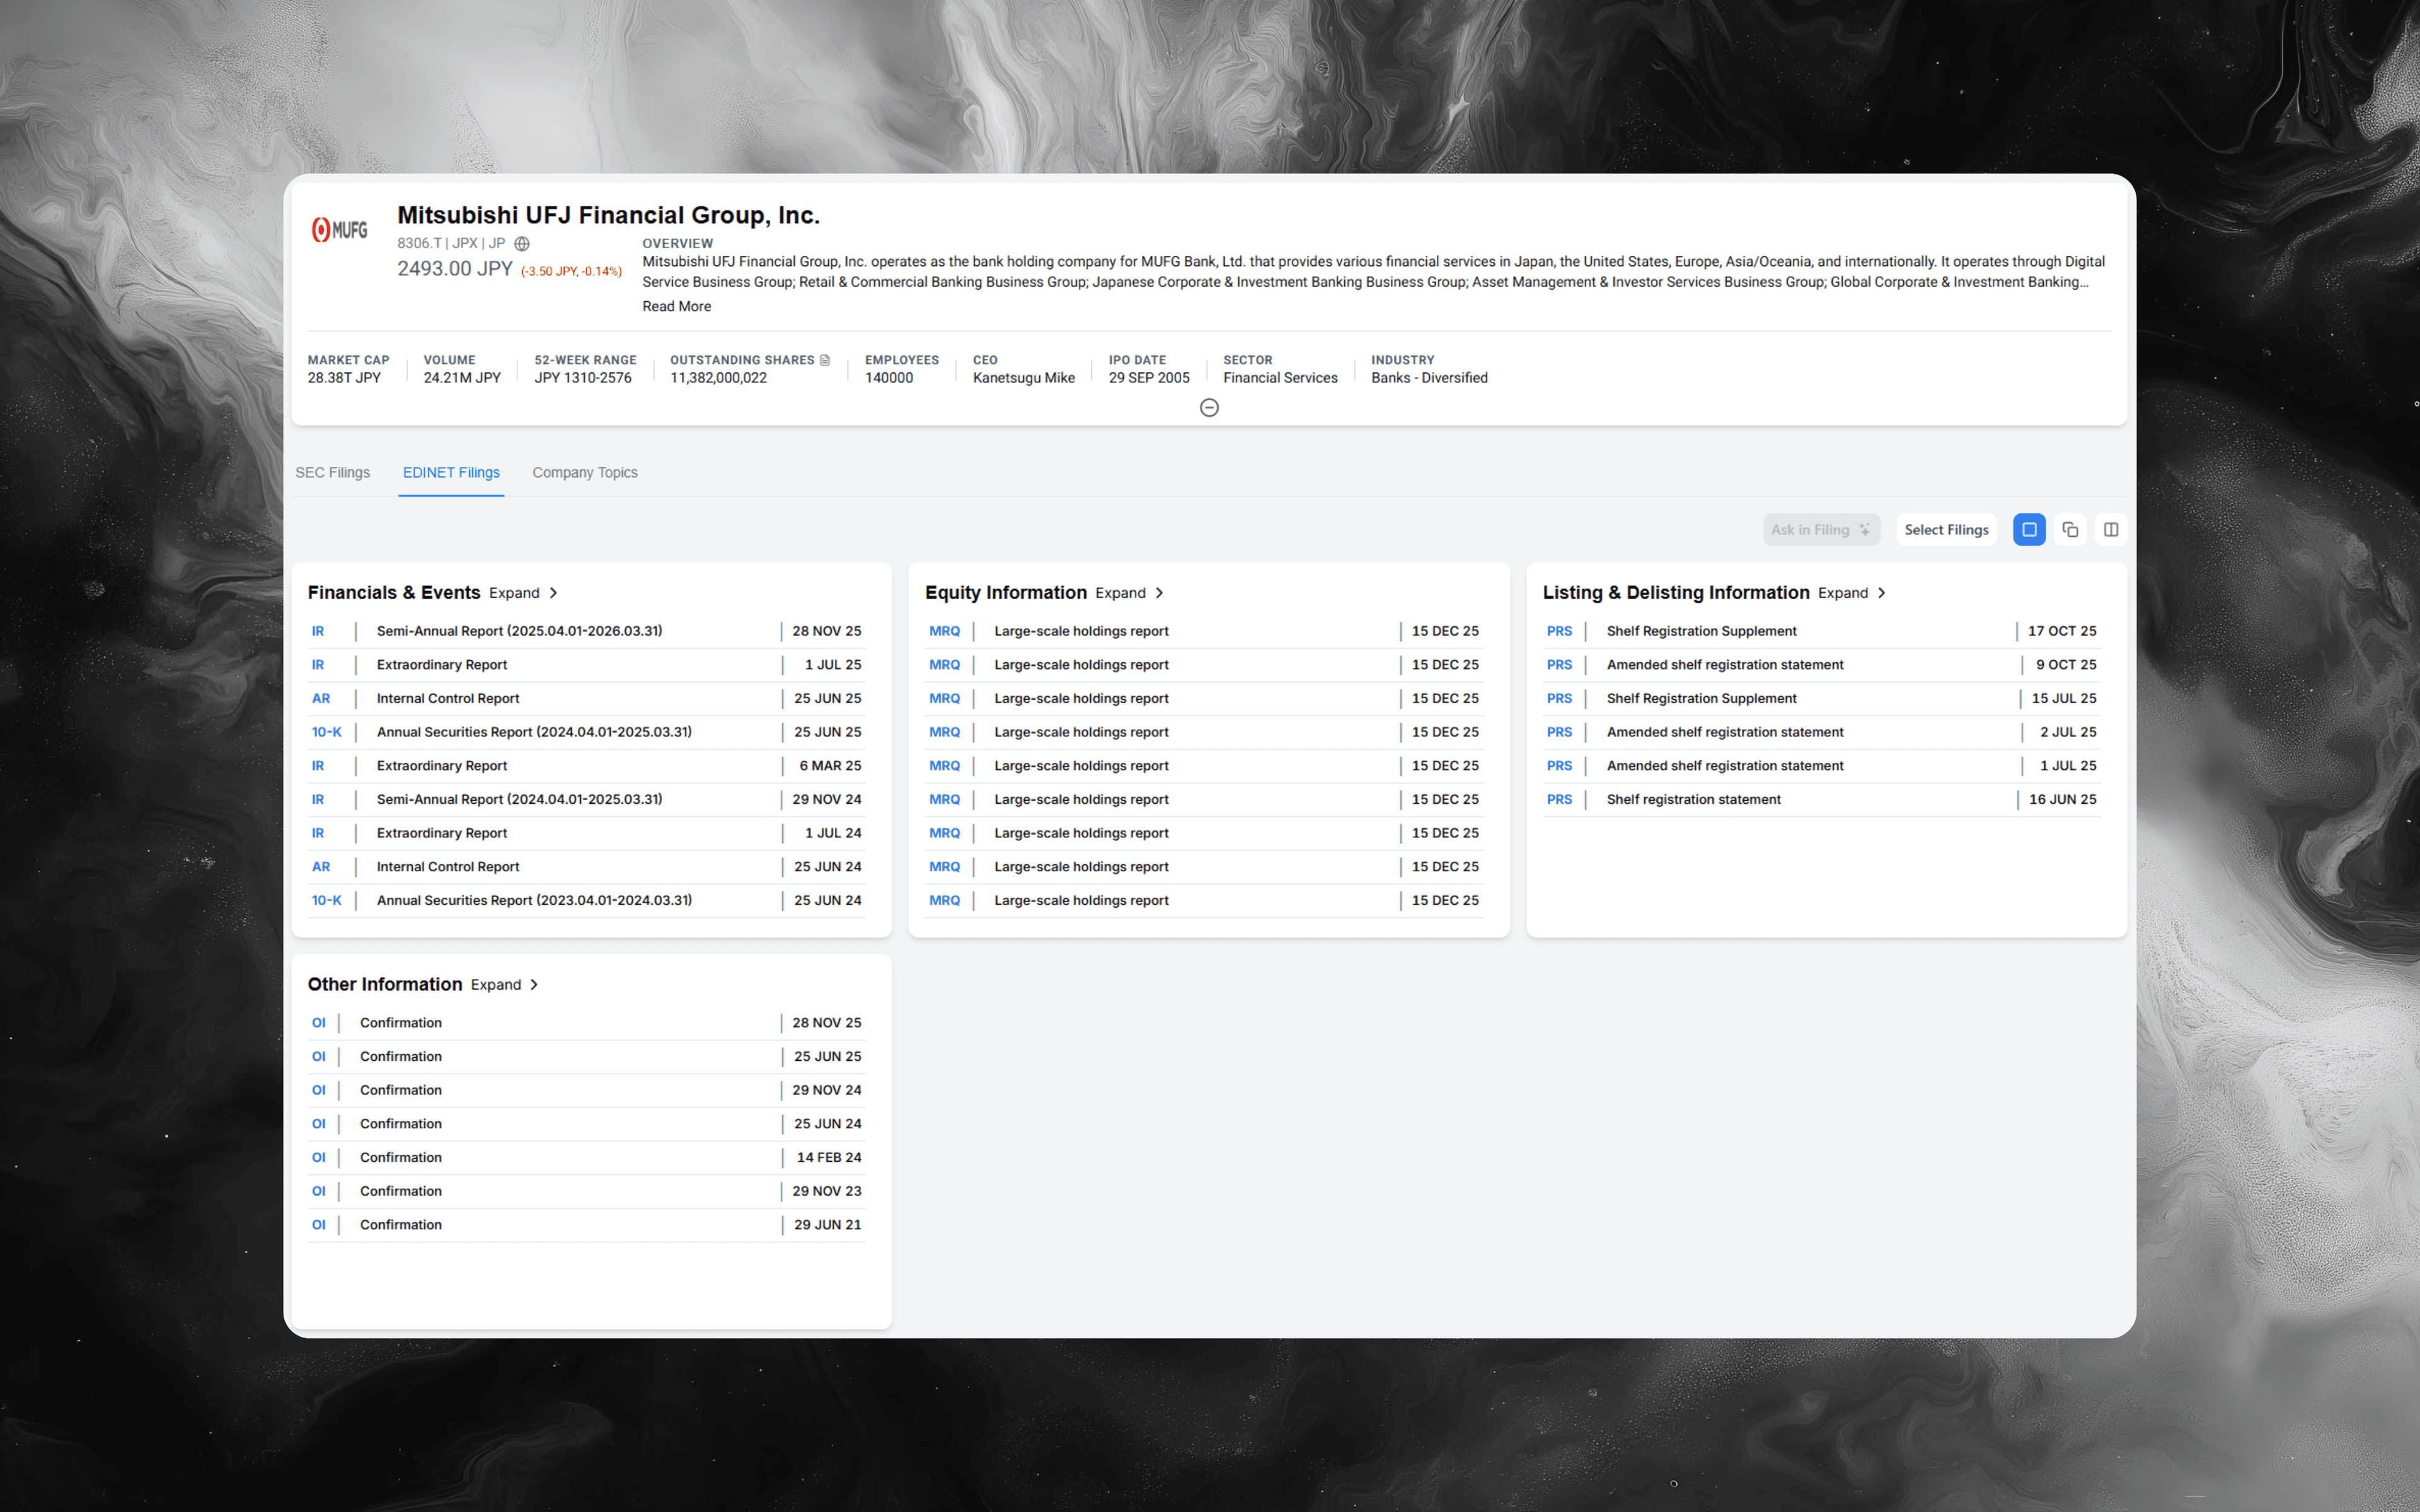
If you want the primary-source foundation (how MUFG describes its businesses, how it defines interest vs non-interest income, where credit costs flow through the statements, and what management highlights as key risks), start with filings in Alpha Analyst here: Mitsubishi UFJ Financial Group, Inc. (8306.T)
The fastest mental model: MUFG is a balance sheet plus a distribution network
A clean way to understand MUFG is to separate two things:
- The balance-sheet engine (what earns spread)
- The distribution and advisory engine (what earns fees)
Most confusion comes from mixing these together. A bank can look “busy” operationally while the economic driver is still mostly: how funding costs, asset yields, and credit losses evolve over time.
For a direct comparison to another global banking giant and its model, see What Does Wells Fargo (WFC) Actually Do?.
How MUFG makes money (the step-by-step operating loop)
Use this operating loop to connect customer activity to earnings:
-
Funding comes in (especially deposits)
Deposits are often the foundational funding source. Their “stickiness” and repricing behavior can matter as much as loan growth. -
MUFG deploys funds into interest-earning assets
Loans (consumer and corporate) and securities portfolios tend to be the largest buckets. Mix matters: yields, credit risk, and duration are not interchangeable. -
Net interest income (NII) is the core spread
NII generally reflects:- volume (how much the group has on the balance sheet)
- margin (how assets and liabilities reprice as rates move)
-
Non-interest (fee) income adds a second earnings stream
Large financial groups typically generate fees from activities such as payments/transaction banking, trust-related services, asset/wealth management, and securities/capital markets services (where applicable). These can behave differently from NII through cycles. -
Credit costs reduce earnings when borrowers weaken
The “credit cost” story usually shows up through provisions, reserve changes, and charge-offs (depending on accounting and disclosure conventions). The key is whether changes are broad-based or concentrated. -
Capital, liquidity, and regulation shape what MUFG can do next
For banks, capital and liquidity are not “back office” constraints. They can be binding variables that drive pricing, asset mix, growth choices, and payout decisions.
Analyst takeaway: bank growth is only good if it is profitable after funding costs, credit costs, and capital usage. Always ask: growth in what, funded how, with what downside in a stress scenario?
What MUFG “sells” in analyst language (products you can map to disclosures)
Even if MUFG uses its own segment labels, many global banks can be translated into a few product families:
-
Retail and consumer finance
Deposit accounts, consumer lending, cards/consumer finance products, and everyday payment services. -
Corporate and commercial banking
Relationship lending, revolvers/term loans, trade finance, and industry-specific credit exposure. -
Transaction banking (cash management)
Services tied to how companies move money: treasury/cash management, settlements, and related fee streams that often strengthen operating deposit relationships. -
Trust, asset, and wealth-related activities
Trust and custody-like services, asset management/wealth advisory, and other fee-driven lines where scale and distribution matter. -
Markets and securities-related activities (where applicable)
Customer flow, underwriting/advisory, and trading-related revenues can be more variable than spread income and tend to deserve separate monitoring.
When reading filings, try to map each business to: primarily spread-driven vs primarily fee-driven. That one split clarifies how results may react to rate changes, credit cycles, and market volatility.
The four metrics that explain most bank quarter-to-quarter change
For MUFG (and most banks), you can usually explain a large share of the quarter using four drivers:
-
Net interest income direction (and why)
Look for what management says about:- deposit mix (who holds the deposits and how rate-sensitive they are)
- funding costs (including any wholesale funding reliance)
- loan and securities yields
- how quickly assets vs liabilities reprice
-
Credit costs (and concentration risk)
Don’t only track the total. Track where it comes from:- consumer vs corporate
- specific industries
- real estate-related exposure (often a key area to monitor across global banks)
-
Expenses and operating leverage
Banks can have heavy fixed costs: people, technology, risk, compliance, distribution. The story is often whether cost growth is structural investment vs remediation vs one-time items. -
Capital and liquidity position
Even if earnings are strong, a bank may be constrained (or empowered) by capital ratios, liquidity buffers, and regulatory requirements. Those constraints can change product strategy quickly.
How to read MUFG filings like an analyst (a repeatable checklist)
Use this checklist each reporting cycle to keep your process consistent:
-
Start with “what changed,” not the headline numbers
Your first pass should identify changes in:- balance sheet composition (loan mix, securities mix)
- funding mix (deposits vs other funding)
- credit indicators (early delinquencies, watch lists, charge-offs where relevant)
-
Force a two-bucket revenue bridge
Build a simple bridge every period:- spread revenue (NII)
- fee/other revenue (non-interest)
This prevents one narrative (like “rates”) from crowding out the rest.
-
Treat credit provisioning language as a forward-looking signal
Credit costs can reflect management assumptions as much as current losses. Track what changed in the outlook language and what portfolios are driving it. -
Read risk disclosures with a “where could losses come from?” lens
Prioritize changes in:- risk factor wording
- credit concentration and sensitivity discussion
- liquidity/rate sensitivity disclosures Edits and new emphasis are often more informative than long static boilerplate.
-
Make capital and liquidity part of the business story
Capital and liquidity are not just compliance metrics. They influence pricing, product appetite, and strategic flexibility.
For practical tips on using technology to accelerate the bank analysis workflow—especially when comparing filings, extracting key data, or searching large sets—see One-Click 10-K & 10-Q Financials to Excel and AI Search for SEC Filings, Rebuilt From the Ground Up.
Keywords to search in MUFG filings (so you don’t miss the signal)
If you cover MUFG repeatedly, run the same searches each cycle and compare how language shifts over time:
- “net interest income” and “net interest margin”
- “deposit” and “funding” and “liquidity”
- “interest rate risk” and “sensitivity”
- “loan” and “credit quality”
- “allowance” and “provision” and “expected credit losses”
- “non-interest income” and “fees”
- “capital” and “capital ratio”
- “risk management” and “stress”
- “real estate” and “commercial real estate”
- “hedging” and “ALM” (asset-liability management)
In Alpha Analyst, these searches become more precise when you use phrase matching and proximity-style operators (so you catch the passages where the terms appear together, not pages apart).
How to do MUFG research faster in Alpha Analyst (a workflow you can reuse)
If MUFG is a recurring coverage name, the biggest speed-up is turning diligence into a reusable system:
-
Save your “bank core” searches once
Build a compact set of saved searches (NII, deposits/funding, rate sensitivity, credit costs, capital/liquidity, key portfolios). Reuse them each cycle so your process stays consistent. -
Put those saved searches on a monitoring dashboard
Create a workspace with Recent Filings plus your saved keyword searches filtered to MUFG, so new disclosures surface automatically as they publish. -
Use AI Chat to translate dense banking language into decision-ready answers
Examples to ask while scoping the document universe to the specific filing(s) you’re reviewing:- “What changed in MUFG’s funding cost and deposit commentary this period?”
- “Where do they describe interest-rate risk and balance-sheet sensitivity?”
- “Which portfolios drove credit costs, and what is management signaling about forward risk?”
-
Annotate the few passages that explain the quarter
Highlight the sections that actually move your model (repricing, mix shifts, reserve drivers, cost actions, capital constraints). Next cycle, your notes become your fastest starting point.
For a broader workflow perspective and analyst best practices, see Day in the Life of an Investment Analyst: A Realistic Playbook.
Explore MUFG filings in Alpha Analyst
To validate how MUFG describes its operating model, where earnings are coming from, and what is changing in risk disclosure language over time, go straight to the primary-source filings: Mitsubishi UFJ Financial Group, Inc. (8306.T)
CTA: Use Alpha Analyst to save a repeatable MUFG bank-diligence search set (NII, funding, credit, capital), pin it to a dashboard, and let new MUFG disclosures surface automatically as soon as they’re filed.
Related Posts
View all posts →
January 16, 2026
Amgen (AMGN) Deep Dive: Products, Pipeline, and Key Risks
A practical equity-research playbook for underwriting the next leg of growth, margin durability, and biosimilar exposure

January 16, 2026
Daikin Industries (6367): A Deep-Dive Equity Research Playbook
Business model, segment drivers, key risks, and how to build a thesis faster in Alpha Analyst

January 16, 2026
Bridgestone (5108): Deep Dive on Segments, Strategy, and Risks
A fundamentals-first breakdown of how the tire leader makes money, what’s changing in 2024–2026, and what to monitor next

January 16, 2026
Panasonic (6752) Deep Dive: Segments, Strategy, and Key Watch Items
A filing-driven look at Panasonic Holdings’ business mix, portfolio moves, and the debates that matter for investors

January 16, 2026
Gilead Sciences (GILD) Deep Dive: Business, Moats, and Key Risks
A practical investor framework for underwriting Gilead’s HIV-led cash flows, oncology optionality, and policy-driven headwinds
Explore More
View all posts →
February 4, 2026
Software Stocks and AI Disruption Fears: Investor Playbook
How to evaluate “AI risk” claims, pressure-test seat-based pricing, and track what matters in filings using Alpha Analyst

February 4, 2026
Enphase (ENPH) Upgrade After Earnings: What Changed
A practical investor brief on the BMO upgrade, Q4 beat, 2026 guideposts, and how to track follow-through in Alpha Analyst

February 4, 2026
Tether fundraising report: what changed and how to track it
A practical framework for monitoring stablecoin issuer valuation, liquidity, and regulatory signals with Alpha Analyst