

What Does Toyota (7203) Actually Do?
A plain-English map of Toyota’s profit engine, key segments (auto + financing), and what to track in its 20-F filings

Table of Contents
A plain-English explanation of Toyota’s business model (cars + financing + “mobility” bets)
What does Toyota (7203) actually do? At a high level, Toyota Motor Corporation designs, manufactures, and sells vehicles and parts around the world. It also runs a large financial services operation that helps dealers and customers finance or lease vehicles, which can be a meaningful (and differently-cyclical) earnings stream versus building and selling cars.
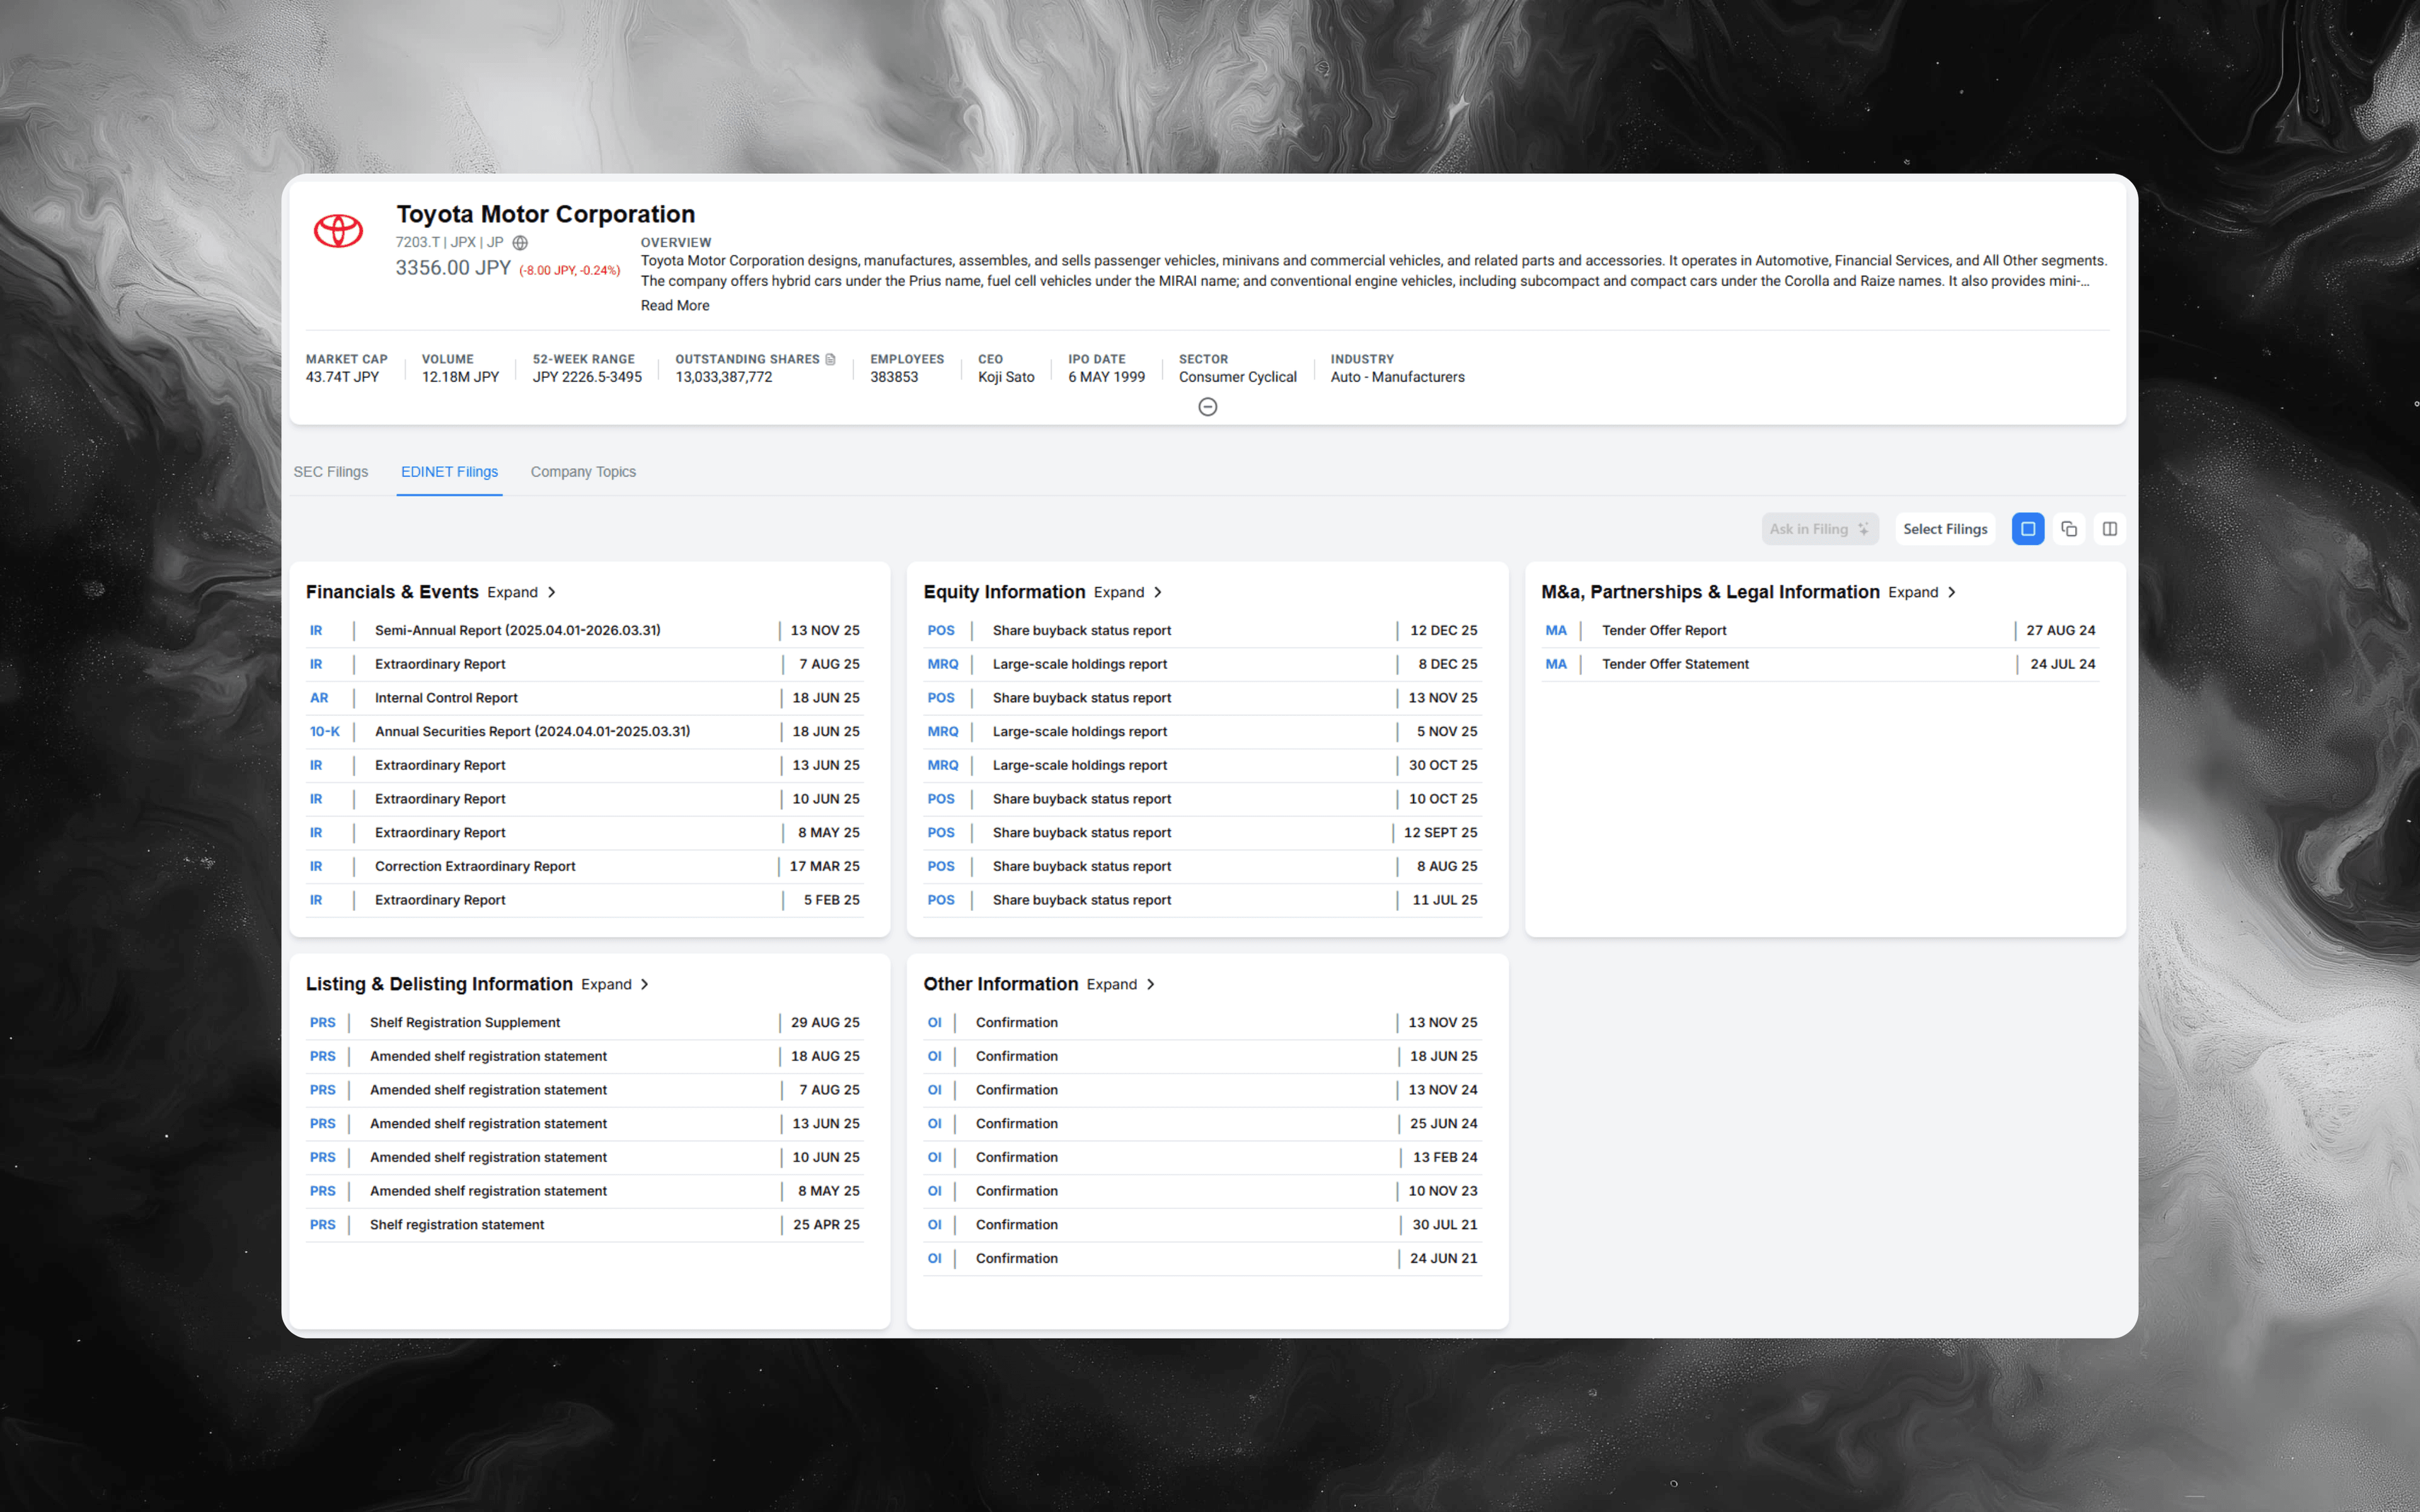
If you want the primary-source foundation (how Toyota defines its segments, how it explains profitability drivers, and what risks management highlights), start with filings in Alpha Analyst here: Toyota Motor Corporation (TM)
The fastest mental model: a manufacturing flywheel plus a financing layer
Toyota can look complicated because it blends an industrial operating model with a balance-sheet business.
A simple way to hold it in your head:
- Automotive operations are about volume, mix, pricing, and cost control
- Financial services are about financing volume, credit performance, funding costs, and interest-rate moves
- “All other” is smaller, but can contain strategic initiatives (and noise)
- Currency, regulation, and quality actions can materially move results
If you keep those buckets separate, Toyota’s disclosures become much easier to interpret quarter after quarter.
What Toyota sells (in segment language)
Toyota’s filings describe three primary segments:
-
Automotive operations
The design, manufacture, assembly, and sale of vehicles and related parts and accessories. -
Financial services operations
Financing and leasing programs for customers and dealers to support vehicle sales, including retail installment financing and leasing through dealer-originated contracts (and related activities such as insurance in certain markets). -
All other operations
Smaller, non-automotive businesses (Toyota’s filings include examples such as information technology-related businesses).
One practical analyst habit: don’t just read the segment names. Translate each segment into its economic model (manufacturing margin vs financing spread/credit) and you’ll ask better questions.
If you're interested in how other automakers adapt their business models and segment logic, the Electric Vehicle Trends 2025: What to Watch Next playbook can help contextualize Toyota's mobility strategy and market positioning.
How Toyota makes money (the step-by-step operating loop)
Here’s a repeatable operating loop that connects customers to earnings:
-
Toyota manufactures vehicles and parts, then sells them through regional operations and dealer networks
“Volume” matters, but “mix” can matter even more: different models, trims, and powertrains can carry very different margins. -
Pricing, incentives, and marketing determine how much revenue turns into gross profit
Incentive intensity can change fast with competition, inventory, and macro demand. -
Costs and efficiency determine whether profit expands or contracts
Raw materials, logistics, manufacturing utilization, warranty/quality costs, and R&D can all overwhelm small pricing moves. -
Financial services supports sales and generates its own earnings stream
Financing and leasing can help move product, but it also creates a separate set of risks: credit losses, funding costs, and interest-rate exposure. -
Consolidated results then get “translated” by currency and shaped by regulation
For a global company, foreign exchange can be a real business variable, not just an accounting artifact. Recalls and other safety measures can also create large, uneven costs.
A quick “segment lens” using Toyota’s own disclosures
Toyota’s 20-F disclosures separate revenue and operating income by segment, which is useful for building intuition.
For fiscal 2024 (year ended March 31, 2024), Toyota disclosed, among other items:
- Total sales revenues of ¥45,095.3 billion
- Segment revenues to external customers of:
- Automotive: ¥41,080.7 billion
- Financial Services: ¥3,447.2 billion
- All Other: ¥567.4 billion
- Operating income by segment of:
- Automotive: ¥4,621.5 billion
- Financial Services: ¥570.0 billion
- All Other: ¥175.2 billion
Analyst takeaway: Toyota is overwhelmingly an automotive business by revenue, but the financial services segment can still be strategically important (supporting demand and contributing profit with a different sensitivity profile).
If you want an industry-wide lens on recurring profit engines and segment reporting, see What Does Honda (7267) Actually Do? for a comparable breakdown, or review the Manufacturing Trends 2025: 5 Signals to Monitor for sector-level drivers.
The Toyota-specific drivers analysts usually track
When you cover an automaker, it’s easy to default to “units up/down.” For Toyota, a better checklist is:
-
Unit volume, plus mix and regional performance
Toyota discloses unit sales by geography in its 20-F. Use that to avoid broad generalizations like “demand was strong” when it may be market-specific. -
FX sensitivity and translation effects
Toyota’s disclosures often discuss exchange-rate impacts explicitly. Treat FX commentary as part of the operating narrative, not a footnote. -
Incentives, marketing, and pricing discipline
Watch for changes in language around incentives and competitive intensity. Small wording changes often precede margin changes. -
Input costs and cost-reduction framing
Pay attention to how Toyota categorizes cost headwinds and cost-reduction efforts. It’s often where management “explains” the quarter. -
Quality actions: warranty, recalls, and related accruals
Quality actions can move quickly from “risk factor” to “earnings driver.” Track how Toyota discusses quality assurance liabilities and related costs. -
The mobility and technology transition
Toyota discusses industry transformation themes (including connected/autonomous/shared/electric technologies) and its longer-term “mobility company” ambition. Treat this as a strategic layer on top of the near-term earnings engine.
For a cross-industry perspective on tracking filings and quarterly results, One-Click 10-K & 10-Q Financials to Excel is a useful resource to accelerate your filing review process for global manufacturers.
How to read Toyota’s 20-F like an analyst (repeatable workflow)
Use this each filing cycle to stay consistent:
-
Start with the segment table, then work backward
Before reading long narrative sections, anchor your understanding in:- segment revenue, and 2) segment operating income.
Then ask: what changed in auto vs financial services vs all other?
- segment revenue, and 2) segment operating income.
-
Build two bridges: Automotive and Financial Services
Don’t blend them together. Make yourself explain:- Automotive: volume, mix, pricing/incentives, FX, costs, quality
- Financial services: contract count/volume, funding costs, credit losses, valuation items (where relevant), FX
-
Treat geographic disclosures as a “demand reality check”
Toyota sells globally, and performance can diverge sharply by region. Use geographic tables to pressure-test any single narrative. -
Read “risk factors” for what changed, not what stayed the same
Risk sections are long. The signal is often in edits: new risks, re-ordered priorities, or sharper language around known issues (regulation, supply chain, cybersecurity, investigations, quality actions). -
Keep a running “next quarter questions” list
The best research habit is ending each reading session with 5–10 questions you’ll try to answer next quarter (e.g., incentives, mix, interest-rate exposure in financial services, specific regulatory pressure points).
For broader analyst workflow tips and daily research best practices, you might also consider the Day in the Life of an Investment Analyst: A Realistic Playbook.
High-signal keywords to search in Toyota filings
If you want a consistent process, run the same searches each year and compare language changes:
- “segment information”
- “Automotive” NEAR “operating income”
- “Financial services” NEAR “operating income”
- “sales incentives” OR “incentive”
- “warranty” OR “quality assurance” OR “recall”
- “exchange rates” OR “foreign exchange”
- “raw materials” OR “cost reduction efforts”
- “production” NEAR “capacity”
- “Connected” OR “Autonomous” OR “Shared” OR “Electric”
- “leasing” OR “financing contracts” OR “credit losses”
In Alpha Analyst, these are especially effective when you use phrase matching and proximity-style operators to reduce noise and keep results comparable across filing periods.
How to research Toyota faster in Alpha Analyst
If you cover Toyota repeatedly, the goal is to turn one-off diligence into reusable monitoring:
-
Save your Toyota searches once, then reuse them every filing cycle
Build a “Toyota core” pack: segments, incentives, FX, warranty/recalls, cost framing, financial services credit, and mobility strategy language. -
Pin saved searches to a dashboard for ongoing monitoring
Create a workspace with Recent Filings plus your saved keyword searches filtered to Toyota, so new disclosures surface as soon as they’re filed. -
Use AI Chat to translate dense filings into decision-ready answers
Example prompts:- “What changed in Toyota’s segment profitability this year, and why?”
- “Where do they discuss FX impacts, and what’s the directionality?”
- “What do they say about incentives, competition, and pricing?”
- “How is the financial services segment performing, and what risks are highlighted?”
Keep it grounded by filtering the document universe to the specific 20-F (and any related filings) you’re reviewing.
-
Annotate the few passages you’ll want next year
Highlight the paragraphs that explain the quarter’s inflections (mix, incentive pressure, cost framing, quality actions, financing conditions). Centralized notes make annual comparisons much faster.
If your research involves other large manufacturers or diversified multinationals, What Does Caterpillar (CAT) Actually Do? offers another example of mapping segmentation and earnings drivers with a repeatable workflow.
Explore Toyota filings in Alpha Analyst
To validate how Toyota describes its operating model, how automotive and financial services interact, and what is changing in risk and strategy language over time, go straight to the primary-source filings: Toyota Motor Corporation (TM)
CTA: Use Alpha Analyst to search across Toyota filings with advanced keyword operators, save your highest-signal Toyota queries, and pin them to a dashboard so new Toyota disclosures surface immediately when they’re published.
Related Posts
View all posts →
January 16, 2026
Amgen (AMGN) Deep Dive: Products, Pipeline, and Key Risks
A practical equity-research playbook for underwriting the next leg of growth, margin durability, and biosimilar exposure

January 16, 2026
Daikin Industries (6367): A Deep-Dive Equity Research Playbook
Business model, segment drivers, key risks, and how to build a thesis faster in Alpha Analyst

January 16, 2026
Bridgestone (5108): Deep Dive on Segments, Strategy, and Risks
A fundamentals-first breakdown of how the tire leader makes money, what’s changing in 2024–2026, and what to monitor next

January 16, 2026
Panasonic (6752) Deep Dive: Segments, Strategy, and Key Watch Items
A filing-driven look at Panasonic Holdings’ business mix, portfolio moves, and the debates that matter for investors

January 16, 2026
Gilead Sciences (GILD) Deep Dive: Business, Moats, and Key Risks
A practical investor framework for underwriting Gilead’s HIV-led cash flows, oncology optionality, and policy-driven headwinds
Explore More
View all posts →
February 4, 2026
Software Stocks and AI Disruption Fears: Investor Playbook
How to evaluate “AI risk” claims, pressure-test seat-based pricing, and track what matters in filings using Alpha Analyst

February 4, 2026
Enphase (ENPH) Upgrade After Earnings: What Changed
A practical investor brief on the BMO upgrade, Q4 beat, 2026 guideposts, and how to track follow-through in Alpha Analyst

February 4, 2026
Tether fundraising report: what changed and how to track it
A practical framework for monitoring stablecoin issuer valuation, liquidity, and regulatory signals with Alpha Analyst