

What Does Netflix (NFLX) Actually Do?
A plain-English map of the streaming model: how subscriptions and ads become revenue, what drives content spending, and what to track in filings
By Michael Chen

Table of Contents
A simple explanation of Netflix’s business model (it’s “paid membership + content engine”)
What does Netflix (NFLX) actually do? Netflix is a global entertainment company that produces and licenses film and TV content, distributes it primarily through its streaming service, and monetizes audience attention through paid memberships (and, in some markets, advertising). The economic engine is straightforward: Netflix invests heavily in content that keeps subscribers engaged, converts new members, and reduces churn, then reinvests the resulting cash flow into more content and product improvements.
If you want the primary-source foundation (business description, risk factors, content accounting, segment/geography disclosures, and the language management uses to explain demand), start with the filings in Alpha Analyst here: Netflix, Inc. (NFLX)
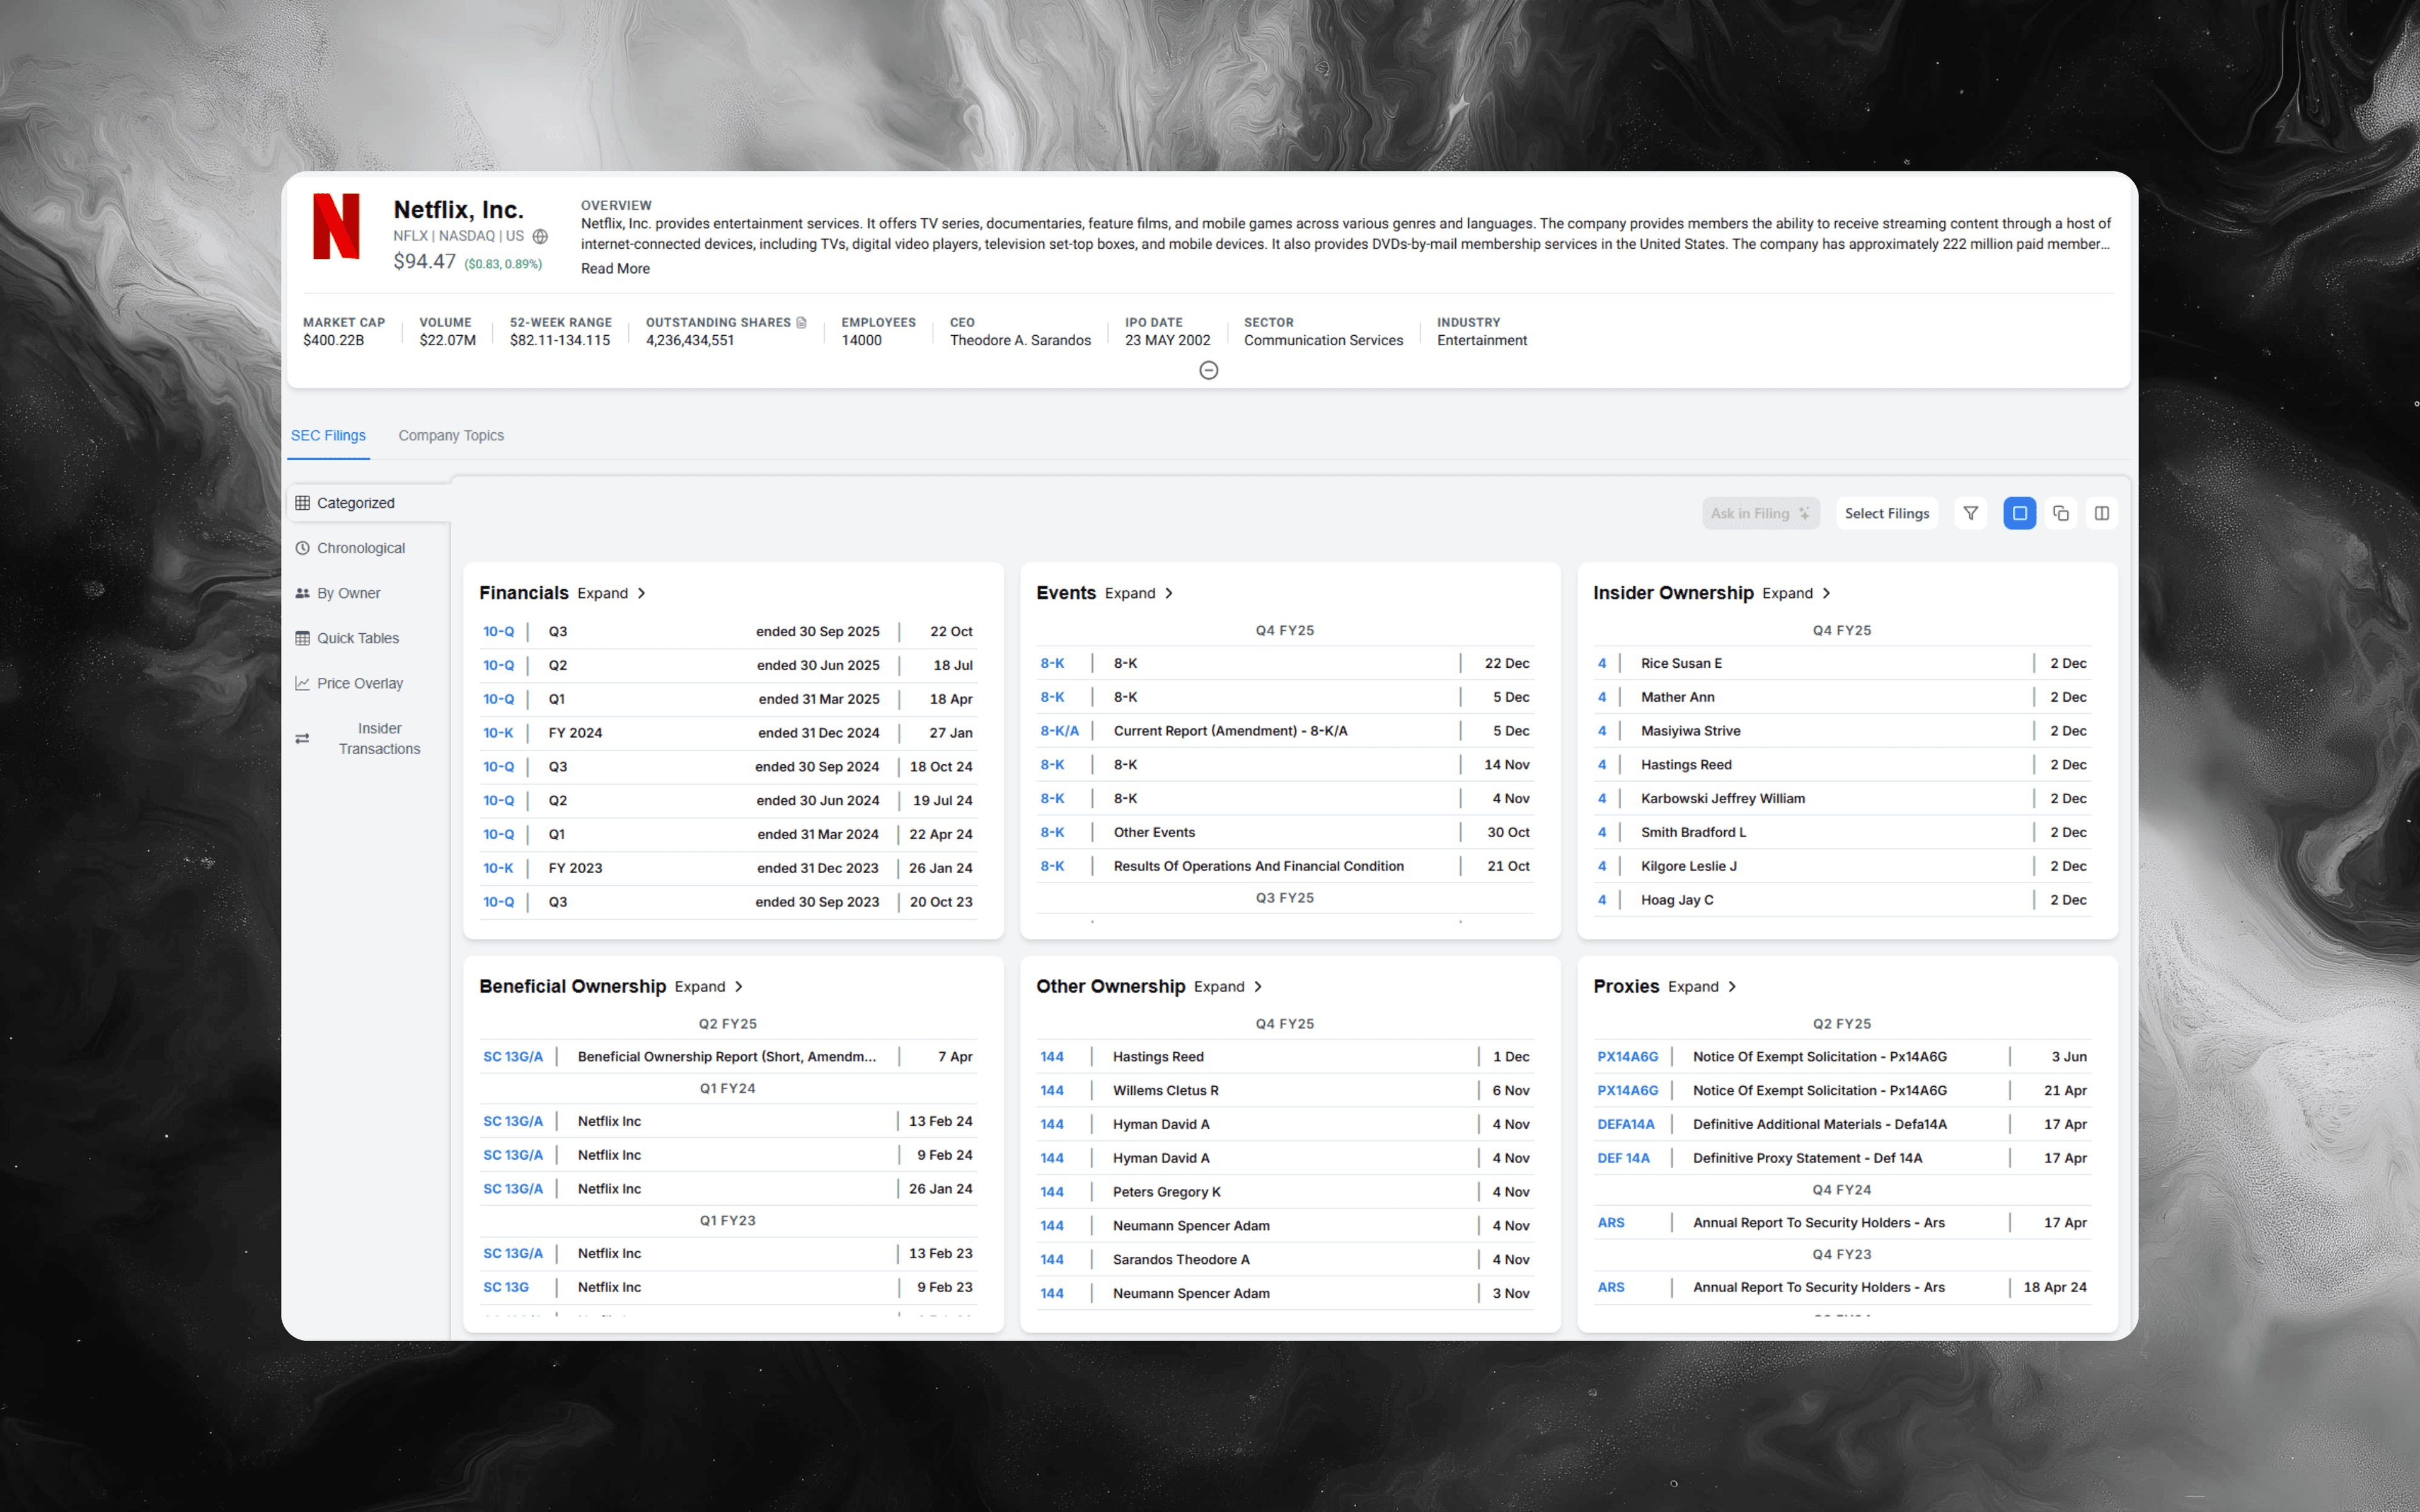
Table of contents
- The fastest mental model: Netflix sells recurring entertainment, not “shows”
- How Netflix turns a hit series into revenue (step-by-step)
- What Netflix sells, and who the customer really is
- The key revenue drivers to track quarter after quarter
- The cost structure: why content accounting is the heart of the model
- A practical checklist for reading NFLX filings like an analyst
- Explore Netflix filings in Alpha Analyst
The fastest mental model: Netflix sells recurring entertainment, not “shows”
A useful way to explain Netflix to a non-specialist is:
Netflix is a subscription business built on a content flywheel: it funds a steady pipeline of programming to earn recurring monthly payments from members and keep churn low.
Two ideas make this click:
-
The unit of sale is membership
Netflix doesn’t need each title to be profitable on its own. What matters is whether the overall catalog helps acquire, retain, and re-engage members over time. -
Content is both product and inventory
The “product” is what you watch, but financially, content behaves like a long-lived asset that’s paid for up front and then expensed over time as it’s consumed (based on Netflix’s accounting policies).
For more industry-wide signals about how AI is impacting content, distribution, and operational models, see NLP in Financial Research: Practical Use Cases and Playbook.
How Netflix turns a hit series into revenue (step-by-step)
Here’s the operational lifecycle that sits behind the income statement:
-
Content strategy and greenlight
Netflix makes decisions about what to produce, co-produce, or license. This is where portfolio thinking matters: genre mix, local-language strategy, tentpoles vs steady “library builders,” and release cadence. -
Production or licensing execution
Production schedules, vendor capacity, and creative outcomes all translate into cost and timing. For licensed content, the key variable is the terms: window length, territory scope, exclusivity, and payment structure. -
Release and engagement
Engagement is the bridge between creative and financial outcomes. Strong engagement tends to support retention, reduce churn, and drive word-of-mouth acquisition. -
Monetization through monthly memberships (and ads)
If a title strengthens the service’s perceived value, Netflix can capture that value through higher subscriber growth, better retention, and sometimes pricing power (depending on market conditions and competitive intensity). Advertising, where applicable, adds another monetization layer tied to audience and inventory. -
Measurement and portfolio iteration
Netflix can quickly learn what’s working and adjust future spending, marketing intensity, and creative mix. This is why investors often care about the pace and direction of content spend and how management frames efficiency.
What Netflix sells (and who the customer really is)
At the surface, Netflix sells streaming access. But there are multiple “customers” and “decision-makers” in the model:
-
Members (households or individuals)
They decide whether to subscribe, which tier to choose, and whether to keep paying each month. Their behavior shows up indirectly as churn and net adds. -
Platforms and distribution partners
App stores, device makers, and telecom bundles can influence billing friction, discovery, and sometimes take a share of payments depending on arrangement. -
Advertisers (for ad-supported offerings)
If Netflix sells advertising, then ad buyers become another customer group with different needs: reach, targeting, brand safety, measurement, and predictable supply.
A good analyst habit is to separate “viewer love” from “member economics.” A show can be culturally loud but economically modest, while quieter programming can be retention gold.
If you’re interested in seeing analogous sector mapping, check out Day in the Life of an Investment Analyst: A Realistic Playbook for how research workflows adapt across industries.
The key revenue drivers to track quarter after quarter
When you read NFLX, you’re usually trying to explain what changed and whether it’s durable. These are the repeatable drivers that tend to matter most:
-
Member growth vs churn
Subscriber additions can be seasonal, marketing-driven, or title-driven. Churn is often where the real story lives: what’s happening to perceived value and competitive pressure? -
Pricing and plan mix
Netflix can grow revenue via price increases, tier upgrades/downgrades, and mix shifts between lower-priced and higher-priced plans. Mix is easy to miss because it doesn’t always announce itself loudly in headlines. -
Advertising contribution (where applicable)
If ads are part of the model, the questions become: how fast is ad inventory growing, what’s the pricing environment, and does ads broaden the funnel or cannibalize higher-priced tiers? -
Geography and currency effects
Netflix is global. Growth can come from different regions at different times, and FX can change the reported numbers even when underlying member trends are stable. -
Content cadence and “hit rate”
Netflix’s results can be sensitive to the timing of major releases and the breadth of programming that keeps engagement steady between tentpoles.
One sentence summary for a business-model lens:
Netflix’s revenue is recurring membership payments (plus ads in some cases), and the main job of the content portfolio is to maximize lifetime value by keeping churn low and engagement high.
The cost structure: why content accounting is the heart of the model
Netflix often looks like a simple subscription business until you get to cost mechanics. Then it becomes clear the company is also running a massive content investment program.
Key moving parts to watch in filings:
-
Cash spending vs P&L expense timing
Content is typically paid for before it is fully recognized as an expense. That creates a gap between near-term cash flow and reported profitability, depending on the year’s content investment cycle. -
Amortization patterns
Amortization policy matters because it governs when content costs hit the income statement. Investors track whether amortization is accelerating, stabilizing, or being offset by revenue growth. -
Marketing as a “demand accelerator”
Marketing spend can be a lever (launch support, brand awareness, churn defense). The right question is rarely “is marketing up or down?” but “is marketing becoming more efficient for net adds and retention?” -
Technology and product investment
Streaming quality, recommendations, payments, fraud controls, and ad tech (if applicable) all live here. It’s easy to underweight this line item when thinking about Netflix purely as a content studio.
Practical implication: if you’re building a thesis, you typically want a view on content efficiency, not just content scale.
For a closer look at how large companies segment/track cost drivers in related industries (like manufacturing), visit Manufacturing Trends 2025: 5 Signals to Monitor.
A practical checklist for reading NFLX filings like an analyst
Use this checklist to keep your Netflix review consistent across quarters:
-
Start with the business description and segment/geography framing
Note how management describes the product (membership, plans, advertising) and how the company frames its operating segments and key markets. -
Track member metrics and plan mix signals
Even if disclosures evolve over time, look for qualitative language about retention, acquisition channels, pricing actions, and tier adoption. -
Map content obligations and the content asset discussion
Identify how Netflix describes its content spending, commitments, and amortization approach. This is where the model often explains itself. -
Separate one-time items from structural margin drivers
Ask: did margins move because of content amortization, marketing shifts, FX, pricing, or underlying demand quality? -
Read risk factors for what changed, not what’s long-standing
Focus on edits related to competition, regulation, labor/production constraints, content availability, platform dependence, and advertising execution (if relevant). -
Build a repeatable keyword workflow you can reuse every quarter
In Alpha Analyst, you can save a keyword set and rerun it each filing cycle. Example keywords for NFLX: “paid memberships”, “average revenue”, “churn”, “advertising”, “content amortization”, “content obligations”, “foreign exchange”, “pricing”, “competition”, “risk factors”. Save that search and pin it to a dashboard filtered to NFLX so new disclosures surface immediately.
Explore Netflix filings in Alpha Analyst
To validate how Netflix explains its membership economics, how it accounts for content, and what management highlights when the business inflects, go straight to the primary-source filings: Netflix, Inc. (NFLX)
CTA: Use Alpha Analyst to search across NFLX filings with advanced keyword operators, save your best queries, and add them to a dashboard so new Netflix disclosures surface immediately when they’re published.
Related Posts
View all posts →
January 31, 2026
Fed Chair Nomination News: What Hassett’s Comments Signal
A practical guide to tracking Fed leadership changes, confirmation risk, and market reactions using filings, search, and dashboards

January 29, 2026
New York Fiscal Crisis: A Company Impact Playbook
How to map NYC budget stress to revenue, taxes, real estate, and credit risk across US equities

January 29, 2026
Monetary Debasement and the US Dollar: A Company Playbook
What “currency going to hell” really means, what could come next for USD, and how US businesses can defend margins, cash flows, and valuation

January 16, 2026
Amgen (AMGN) Deep Dive: Products, Pipeline, and Key Risks
A practical equity-research playbook for underwriting the next leg of growth, margin durability, and biosimilar exposure

January 16, 2026
Daikin Industries (6367): A Deep-Dive Equity Research Playbook
Business model, segment drivers, key risks, and how to build a thesis faster in Alpha Analyst
Explore More
View all posts →
February 4, 2026
Software Stocks and AI Disruption Fears: Investor Playbook
How to evaluate “AI risk” claims, pressure-test seat-based pricing, and track what matters in filings using Alpha Analyst

February 4, 2026
Enphase (ENPH) Upgrade After Earnings: What Changed
A practical investor brief on the BMO upgrade, Q4 beat, 2026 guideposts, and how to track follow-through in Alpha Analyst

February 4, 2026
Tether fundraising report: what changed and how to track it
A practical framework for monitoring stablecoin issuer valuation, liquidity, and regulatory signals with Alpha Analyst