

What Does Hitachi (6501.T) Actually Do?
A plain-English map of Hitachi’s Social Innovation model, its core segments, and what to track in EDINET filings

Table of Contents
A plain-English explanation of Hitachi’s business model (a portfolio of industrial + digital platforms)
What does Hitachi (6501.T) actually do? In plain terms, Hitachi is a diversified Japan-based industrial and technology group that sells a mix of digital services, energy and rail solutions, and industrial/building systems. Instead of relying on one product category, Hitachi is managed as a portfolio of operating segments that are reported in its filings.
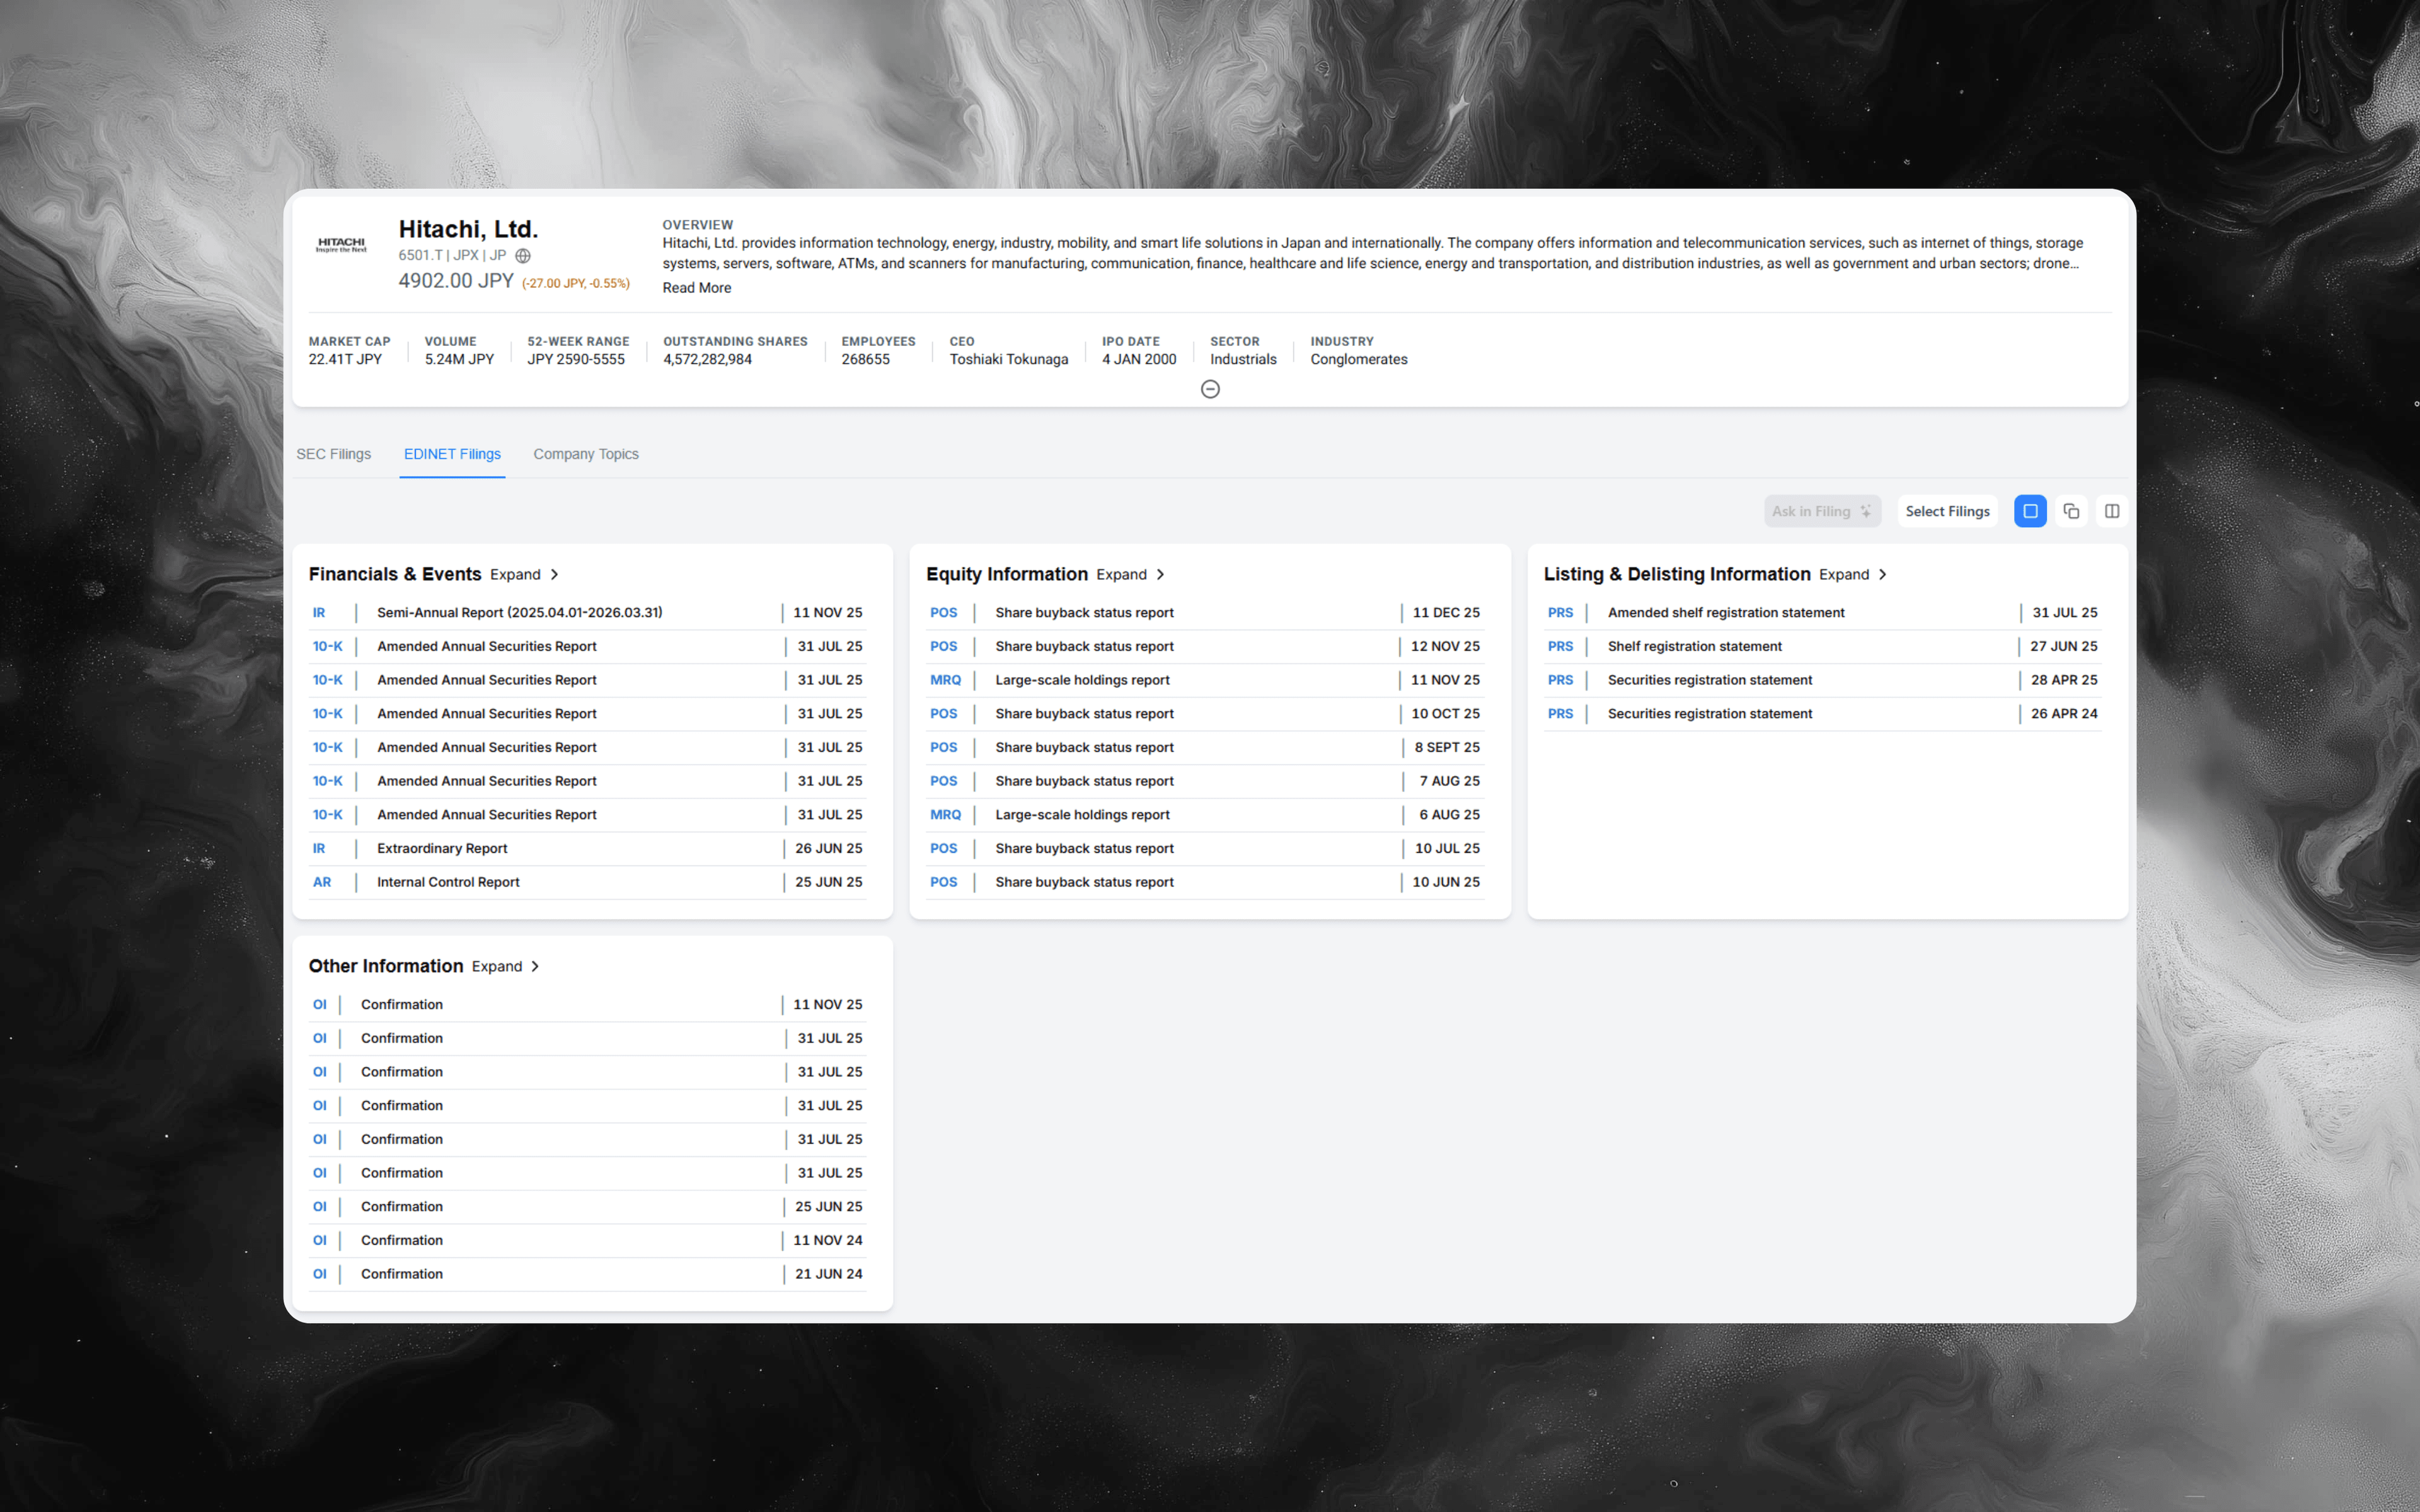
If you want the primary-source foundation (how Hitachi defines each segment, how it measures profitability, and what management highlights as priorities and risks), start with the filings in Alpha Analyst here: Hitachi, Ltd. (6501.T)
The fastest mental model: “projects + platforms,” managed by segment profitability
A simple way to think about Hitachi’s operating engine:
- It sells large, complex systems (often multi-year projects) in areas like energy and rail
- It sells industrial and building products plus ongoing service/maintenance
- It sells digital solutions (systems integration, consulting, cloud services) that can be more recurring in nature
- It manages the mix through a segment structure and capital allocation discipline, using profitability and efficiency metrics
Practical takeaway: for a company like Hitachi, quarter-to-quarter results can be heavily influenced by project mix, execution quality, and currency/region effects, not just “unit volume.”
What Hitachi sells (and how the filings bucket it)
In its annual securities report (EDINET), Hitachi describes four reportable segments:
-
Digital Systems & Services
Digital solutions (system integration, consulting, cloud services) plus IT products and related offerings. -
Green Energy & Mobility
Energy solutions (including power grids and other energy systems) and railway systems. -
Connective Industries
A broad set of industrial and “real-world” systems: building systems (elevators/escalators), lifestyle and ecological systems (home appliances and air conditioning), measurement and analysis systems, industrial/digital solutions, water/environmental solutions, and industrial equipment. -
Other
Activities outside the main segment structure (for example, certain real estate-related or other group functions, depending on how it’s described in the period you’re reading).
Analyst tip: when you read results commentary, force a mapping between “what’s happening in the real world” and “which segment should reflect it.” That’s how you catch whether an issue is isolated or spreading across the portfolio.
How Hitachi makes money (the operating loop that connects customers to earnings)
Use this loop to connect operations to financial statements:
-
Win orders and projects (especially in large systems businesses)
In many industrial groups, backlog and project pipeline matter because revenue recognition is tied to delivery and milestones. -
Deliver systems, products, and services
Execution quality shows up in margins: project overruns, supply chain problems, or unfavorable project mix can compress profitability even if revenue grows. -
Monetize lifecycle services and installed base
For building systems, rail, energy equipment, and industrial products, ongoing service and maintenance can be a stabilizer (and often higher margin) versus one-off hardware. -
Improve segment profitability and capital efficiency
Management often frames performance using profit metrics at the segment level, plus capital efficiency concepts (how much profit a segment generates relative to invested capital).
The key profitability measure to understand: Adjusted EBITA (and why it matters)
Hitachi highlights Adjusted EBITA as a key profitability indicator in its reporting. In filings, it’s described as a profit measure built from operating profit concepts with adjustments (including adding back amortization of intangible assets recognized through business combinations) and, in the current definition shown in the annual report, also incorporating equity-method earnings.
Two things to watch as you read:
-
The exact definition can change over time
Filings may describe upcoming changes to the calculation method. Don’t assume last year’s definition is identical to this year’s. -
Segment profit is presented using this framework
When segment profit is presented as Adjusted EBITA, it becomes the most direct way to compare operating performance across segments without getting lost in one-time items.
Workflow tip: when you compare periods, keep a small “definition box” in your notes with the company’s current wording for Adjusted EBITA so you don’t accidentally mix apples and oranges across years.
What tends to move results quarter to quarter (a practical checklist)
For a diversified industrial/digital group, these drivers often explain most changes:
-
Segment mix shifts
A quarter with stronger project delivery in one segment (or weaker demand in another) can move consolidated margins more than you’d expect. -
Project execution and profitability
Watch for commentary on production efficiency, project mix, and profitability improvements (or the opposite). -
Portfolio changes (acquisitions, divestitures, and equity-method shifts)
Hitachi’s filings discuss acquisitions, business alliances, and the shift of certain businesses into equity-method accounting. These changes can alter comparability and the “shape” of earnings. -
Foreign exchange and regional demand differences
Filings often point out approximate year-on-year changes excluding FX; use that language to separate operational performance from currency translation.
For broader context on the landscape of industrial and technology trends changing the sector, see Manufacturing Trends 2025: 5 Signals to Monitor or Tariffs and Energy & Industrials: A Sector Impact Playbook for frameworks on external drivers, supply chains, and global policy.
How to read Hitachi filings like an analyst (repeatable method)
Use this sequence each cycle:
-
Step 1: Start at segment definitions and any segment reclassifications
If segment categories changed, your trend work needs re-bucketing before you interpret growth or margin direction. -
Step 2: Build a segment bridge (revenue and Adjusted EBITA)
Write down the segment revenue and segment profit. Then answer one question per segment: “What changed, and is it demand, pricing, execution, or mix?” -
Step 3: Sanity-check capital intensity and investment posture
Look for discussion of capital expenditure, impairment, and goodwill/intangible commentary. In portfolio-style groups, this is where you see strategy translate into financial consequences. -
Step 4: Read risk disclosures with a “where can the model break?” lens
Focus on what changed in the language around demand downturns, supply/demand imbalances, inventory actions, integration risk, and restructuring actions.
If you’re analyzing Japanese company filings more broadly, Translated EDINET Japan filings can streamline your process for non-English disclosures and cross-company benchmarking.
High-signal keywords to search in Hitachi filings (and why)
If you want a consistent, high-signal process, run the same searches each period and compare what changed:
- “Adjusted EBITA” and “Adjusted operating profit” (profit definition and bridge language)
- “segment information” and “reportable segments” (structure changes)
- “reclassified” or “reclassification” (comparability alerts)
- “equity method” and “investments accounted for using the equity method” (earnings mix and affiliate risk)
- “goodwill” and “impairment” (M&A payback and downside risk)
- “restructuring” and “business restructuring” (portfolio actions and one-time costs)
- “project” and “production efficiency” (execution quality signals)
- “power grids,” “railway systems,” “elevators,” “air conditioning” (segment-specific demand cues)
In Alpha Analyst, these are especially effective when you use phrase matching and proximity-style operators to keep results focused on the passages that actually explain drivers.
How to research Hitachi faster in Alpha Analyst (a workflow you can reuse)
If you cover Hitachi repeatedly, the goal is to turn your diligence into a reusable system:
-
Save a “Hitachi core” search pack
Create saved searches for segment changes, Adjusted EBITA definition/bridge language, equity-method commentary, goodwill/impairment, and restructuring. Reuse them every filing cycle so you don’t start from scratch. -
Monitor new disclosures with a dashboard
Build a dashboard that includes Recent Filings plus your saved keyword searches filtered to Hitachi. This turns filings into an alerting workflow, not a manual inbox check. -
Use AI Chat for translation and synthesis (grounded in the filing you’re reading)
Example prompts:- “Summarize what changed in each segment’s performance and why.”
- “Where do they explain the drivers of Adjusted EBITA this period?”
- “What segment definitions or reporting changes affect comparability versus last year?”
-
Annotate the few passages that actually explain the quarter
Highlight the segments’ driver paragraphs and any definition changes. Next quarter, your notes become a fast “what matters” index.
For further guidance on using language AI in financial research—including automating document review, synthesis, and insight extraction—see NLP in Financial Research: Practical Use Cases and Playbook.
Explore Hitachi filings in Alpha Analyst
To validate how Hitachi describes its segment structure, what is driving profitability, and what changed in risks and portfolio actions over time, go straight to the primary-source filings: Hitachi, Ltd. (6501.T)
CTA: Use Alpha Analyst to search across Hitachi filings with advanced keyword operators, save your best 6501.T queries, and pin them to a dashboard so new Hitachi disclosures surface immediately when they’re published.
Related Posts
View all posts →
January 16, 2026
Amgen (AMGN) Deep Dive: Products, Pipeline, and Key Risks
A practical equity-research playbook for underwriting the next leg of growth, margin durability, and biosimilar exposure

January 16, 2026
Daikin Industries (6367): A Deep-Dive Equity Research Playbook
Business model, segment drivers, key risks, and how to build a thesis faster in Alpha Analyst

January 16, 2026
Bridgestone (5108): Deep Dive on Segments, Strategy, and Risks
A fundamentals-first breakdown of how the tire leader makes money, what’s changing in 2024–2026, and what to monitor next

January 16, 2026
Panasonic (6752) Deep Dive: Segments, Strategy, and Key Watch Items
A filing-driven look at Panasonic Holdings’ business mix, portfolio moves, and the debates that matter for investors

January 16, 2026
Gilead Sciences (GILD) Deep Dive: Business, Moats, and Key Risks
A practical investor framework for underwriting Gilead’s HIV-led cash flows, oncology optionality, and policy-driven headwinds
Explore More
View all posts →
February 4, 2026
Software Stocks and AI Disruption Fears: Investor Playbook
How to evaluate “AI risk” claims, pressure-test seat-based pricing, and track what matters in filings using Alpha Analyst

February 4, 2026
Enphase (ENPH) Upgrade After Earnings: What Changed
A practical investor brief on the BMO upgrade, Q4 beat, 2026 guideposts, and how to track follow-through in Alpha Analyst

February 4, 2026
Tether fundraising report: what changed and how to track it
A practical framework for monitoring stablecoin issuer valuation, liquidity, and regulatory signals with Alpha Analyst