

What Does Exxon Mobil (XOM) Actually Do?
A plain-English map of the integrated oil model, the segment structure, and a filing-reading checklist for investors
By Michael Chen

Table of Contents
A simple explanation of Exxon Mobil’s business model (it’s an integrated energy and products system)
What does Exxon Mobil (XOM) actually do? Exxon Mobil is an integrated energy company that explores for and produces oil and natural gas, and then turns hydrocarbons into fuels, chemicals, and specialty products through manufacturing, trading, transport, and sales. In its filings, Exxon Mobil describes this integrated model as spanning exploration and production; the manufacture, trade, transport and sale of crude oil, natural gas, petroleum products, petrochemicals, and specialty products; plus a set of lower-emission and other newer opportunities (including carbon capture and storage, hydrogen, lower-emission fuels, and lithium).
If you want the primary-source foundation (business description, segment structure, risk factors, accounting policies, and what management says is driving results), start with the filings in Alpha Analyst here: Exxon Mobil Corporation (XOM)
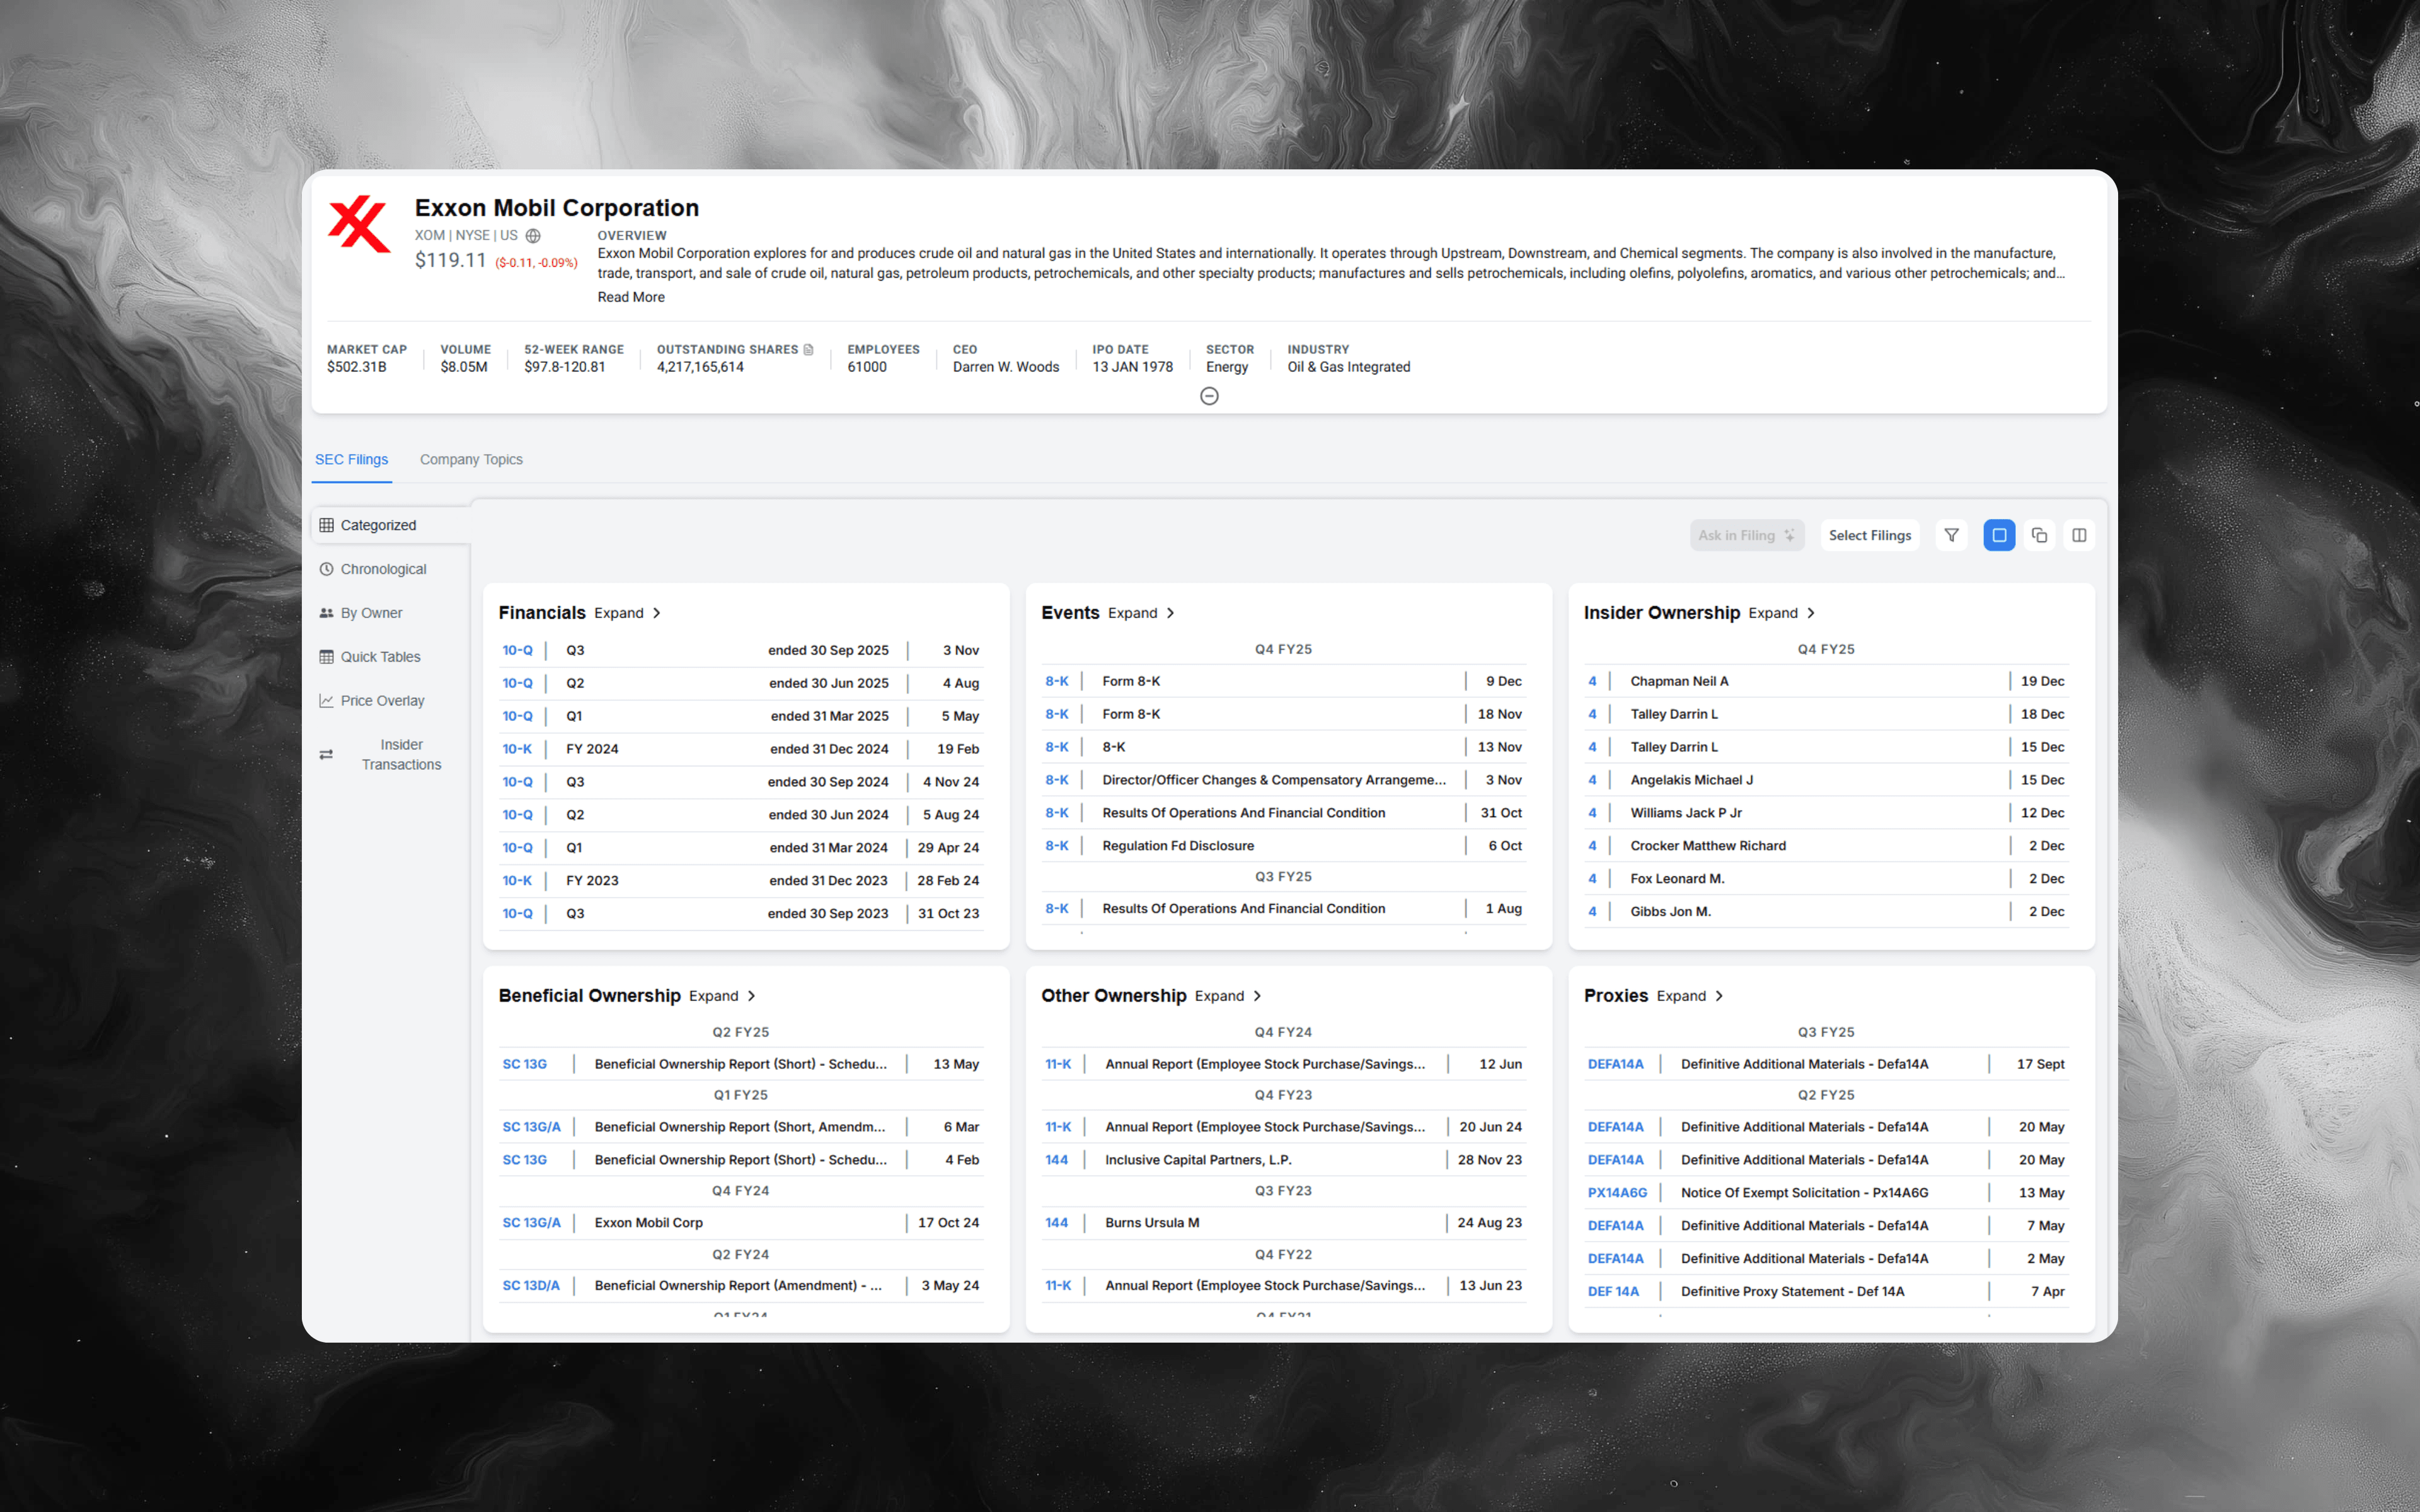
Table of contents
- The fastest mental model: an integrated chain from reservoir to end product
- How Exxon Mobil is organized vs how it reports segments
- What each segment sells (and what tends to move earnings)
- Why “integration” matters: offsets, optimization, and cycle management
- The commodity and margin dashboard investors implicitly track
- A quick checklist for reading XOM filings like an analyst
- Explore XOM filings in Alpha Analyst
The fastest mental model: an integrated chain from reservoir to end product
A clean way to explain Exxon Mobil to a non-specialist is:
Exxon Mobil makes money by producing oil and natural gas and then processing, distributing, and upgrading those molecules into fuels, chemicals, and specialty products, using a global manufacturing and logistics system.
This framing is helpful because it avoids two common mistakes:
- Treating Exxon Mobil as only an exploration-and-production company
- Treating downstream and chemicals as “side businesses,” rather than part of how the company manages cycles and places molecules into higher-value uses
In plain English: upstream creates supply, product businesses upgrade and market supply, and the integrated system is designed to be resilient across commodity and margin cycles.
For a broader understanding of manufacturing dynamics and sector shifts (including energy and industrials), see Manufacturing Trends 2025: 5 Signals to Monitor.
How Exxon Mobil is organized vs how it reports segments
One detail that can confuse new investors is that Exxon Mobil uses two lenses at once:
-
Organizational view (how the company is managed day to day) Exxon Mobil describes being organized along three businesses: Upstream, Product Solutions, and Low Carbon Solutions.
-
Reportable segments (how results are disclosed in financial reporting) In its filings, Exxon Mobil’s reportable segments are Upstream, Energy Products, Chemical Products, and Specialty Products.
A practical bridge between the two:
- Product Solutions is the umbrella that includes Energy Products, Chemical Products, and Specialty Products.
- Low Carbon Solutions is included in Corporate and Financing as the business continues to mature through commercialization and deployment of technology.
This is an important filing-reading habit: when management discusses strategy in one structure and reports financials in another, your job is to translate commentary into the segment lines where performance is actually measured.
If you're interested in reading about how other sector leaders structure their reporting and segment disclosures, consider Day in the Life of an Investment Analyst: A Realistic Playbook.
What each segment sells (and what tends to move earnings)
You can read Exxon Mobil’s segments as four different profit engines that respond to different “price decks” and operating conditions.
Upstream: producing oil and natural gas
What it does:
- Exploration, development, and production of crude oil and natural gas
What usually moves results:
- Realized oil and gas prices
- Production volumes
- Costs, including development and operating costs
- Project timing, decline rates, and operational reliability
The key analyst mindset: Upstream is a price-exposed cash generator in upcycles and a capital-allocation test in downcycles.
Energy Products: converting hydrocarbons into fuels and selling them
What it does (conceptually):
- Manufacturing and marketing fuels and other energy products, plus trading and logistics that help place supply into markets
What usually moves results:
- Refining and marketing margins (the spread between input costs and product values)
- Utilization rates and reliability (unplanned downtime can matter)
- Regional product demand and inventory conditions
The key analyst mindset: Energy Products is less about “oil price up or down” and more about margin environment, asset utilization, and market balances.
Chemical Products: petrochemicals and chemical value chains
What it does (conceptually):
- Produces petrochemicals used in packaging, consumer goods, industrial applications, and other end markets
What usually moves results:
- Chemical margins and spreads
- Feedstock advantage and regional capacity cycles
- End-market demand and pricing discipline across the industry
The key analyst mindset: Chemicals can be a cycle of its own. The commodity is still in the equation, but industry capacity and demand often dominate.
Specialty Products: higher-value, more differentiated products
What it does (conceptually):
- Produces specialty products where performance attributes and customer requirements can matter more than pure commodity pricing
What usually moves results:
- Mix (what you sell and to whom)
- Differentiation, product performance needs, and customer stickiness
- Industrial activity levels and targeted end-market health
The key analyst mindset: Specialty Products can behave more like a “portfolio of niches,” where mix and customer economics can matter as much as the broader commodity tape.
Why “integration” matters: offsets, optimization, and cycle management
Integration is not just a corporate story. It’s a way to understand why results can look different from a pure-play upstream or a pure-play refiner.
Three integration benefits to watch for in filings:
-
Natural offsets across cycles When crude prices rise, upstream may benefit while product margins may tighten. In other periods, upstream realizations may weaken while refining or chemical margins improve. The point is not that offsets are perfect, but that multiple earnings engines can change the slope of the cycle.
-
Optionality in where molecules go A company with trading, logistics, and multiple product outlets can route supply toward better netbacks when markets dislocate.
-
Investment discipline and “portfolio steering” In an integrated model, capital can be redirected toward the most attractive opportunities in the set, rather than being forced into one segment’s cycle.
If you want to pressure-test whether “integration” is helping in a given year, focus on management’s language about mix, margin capture, reliability, and the rationale for the Corporate Plan and investment choices.
For more on how sector-level trends (policy, trade, automation, and energy shocks) can influence companies like XOM, you might refer to Tariffs and Energy & Industrials: A Sector Impact Playbook.
The commodity and margin dashboard investors implicitly track
Even without a spreadsheet, most Exxon Mobil investors end up tracking a recurring set of levers. Use these as your mental dashboard:
- Realized oil and natural gas prices (Upstream sensitivity)
- Production volumes and unit costs
- Refining/energy product margin commentary (spread environment, utilization, downtime)
- Chemical margin environment and capacity cycle language
- Specialty mix and demand signals in key end markets
- Capital allocation language (what gets funded, what gets deferred, and why)
- Emerging business commentary for Low Carbon Solutions (what is being commercialized and how progress is described, given it is included in Corporate and Financing)
In other words: you’re mapping macro conditions into the segment engines, then reading what management says about execution against those conditions.
A quick checklist for reading XOM filings like an analyst
Use this checklist to keep your review consistent quarter to quarter and year to year:
-
Start with how the company describes the integrated model Look for changes in how Exxon Mobil characterizes the interplay among Upstream, Energy Products, Chemical Products, and Specialty Products.
-
Translate organization talk into segment reporting When you see “Product Solutions” or “Low Carbon Solutions,” connect that narrative back to the reportable segment lines (and Corporate and Financing for Low Carbon Solutions).
-
Track which lever management blames or credits As you read MD&A, label each explanation as one of: price, volume, margin, mix, reliability, cost, or timing. Over time, you’ll learn what’s persistent versus one-off.
-
Watch for language shifts in investment discipline Pay attention to how the Corporate Plan is discussed, how assumptions are framed, and how the company talks about reappraisals and learning loops on major projects.
-
Re-read risk factors with a “what changed” mindset You’re not only looking for the risks themselves; you’re looking for edits, expansions, and new emphasis that can signal where management sees pressure.
A practical habit in Alpha Analyst: save a small set of recurring keywords (for example: “segments”, “integrated”, “Product Solutions”, “Energy Products”, “Chemical Products”, “Specialty Products”, “Corporate and Financing”, “Low Carbon Solutions”) and reuse them each quarter to spot what changed in wording and emphasis, not just numbers.
For more playbook approaches to reading filings and segment disclosures like an analyst, explore Day in the Life of an Investment Analyst: A Realistic Playbook.
Explore XOM filings in Alpha Analyst
To validate how Exxon Mobil describes its integrated business model, understand the segment structure, and surface disclosures most likely to move an investment thesis, go straight to the primary-source filings: Exxon Mobil Corporation (XOM)
CTA: Use Alpha Analyst to search across XOM filings with advanced keyword operators, save your best queries, and pin them to a dashboard filtered by your watchlist so new Exxon Mobil disclosures surface the moment they land.
Related Posts
View all posts →
January 31, 2026
Fed Chair Nomination News: What Hassett’s Comments Signal
A practical guide to tracking Fed leadership changes, confirmation risk, and market reactions using filings, search, and dashboards

January 29, 2026
New York Fiscal Crisis: A Company Impact Playbook
How to map NYC budget stress to revenue, taxes, real estate, and credit risk across US equities

January 29, 2026
Monetary Debasement and the US Dollar: A Company Playbook
What “currency going to hell” really means, what could come next for USD, and how US businesses can defend margins, cash flows, and valuation

January 16, 2026
Amgen (AMGN) Deep Dive: Products, Pipeline, and Key Risks
A practical equity-research playbook for underwriting the next leg of growth, margin durability, and biosimilar exposure

January 16, 2026
Daikin Industries (6367): A Deep-Dive Equity Research Playbook
Business model, segment drivers, key risks, and how to build a thesis faster in Alpha Analyst
Explore More
View all posts →
February 4, 2026
Software Stocks and AI Disruption Fears: Investor Playbook
How to evaluate “AI risk” claims, pressure-test seat-based pricing, and track what matters in filings using Alpha Analyst

February 4, 2026
Enphase (ENPH) Upgrade After Earnings: What Changed
A practical investor brief on the BMO upgrade, Q4 beat, 2026 guideposts, and how to track follow-through in Alpha Analyst

February 4, 2026
Tether fundraising report: what changed and how to track it
A practical framework for monitoring stablecoin issuer valuation, liquidity, and regulatory signals with Alpha Analyst