

What Does AbbVie (ABBV) Actually Do?
A plain-English map of the biopharma model: how a drug portfolio becomes revenue, what drives margins, and what to track in filings
By Michael Chen

Table of Contents
A simple explanation of AbbVie’s business model (it’s “drug portfolio + lifecycle management”)
What does AbbVie (ABBV) actually do? AbbVie is a research-based biopharmaceutical company: it discovers or licenses therapies, runs clinical development, manufactures (directly or via partners), and markets prescription medicines globally. The core economic engine is a portfolio of branded therapies that (when successful) can generate multi-year cash flows until competition and loss of exclusivity pressure prices and volumes.
If you want the primary-source foundation (business description, risk factors, segment reporting, major product disclosures, and accounting policies), start with the filings in Alpha Analyst here: AbbVie Inc. (ABBV)
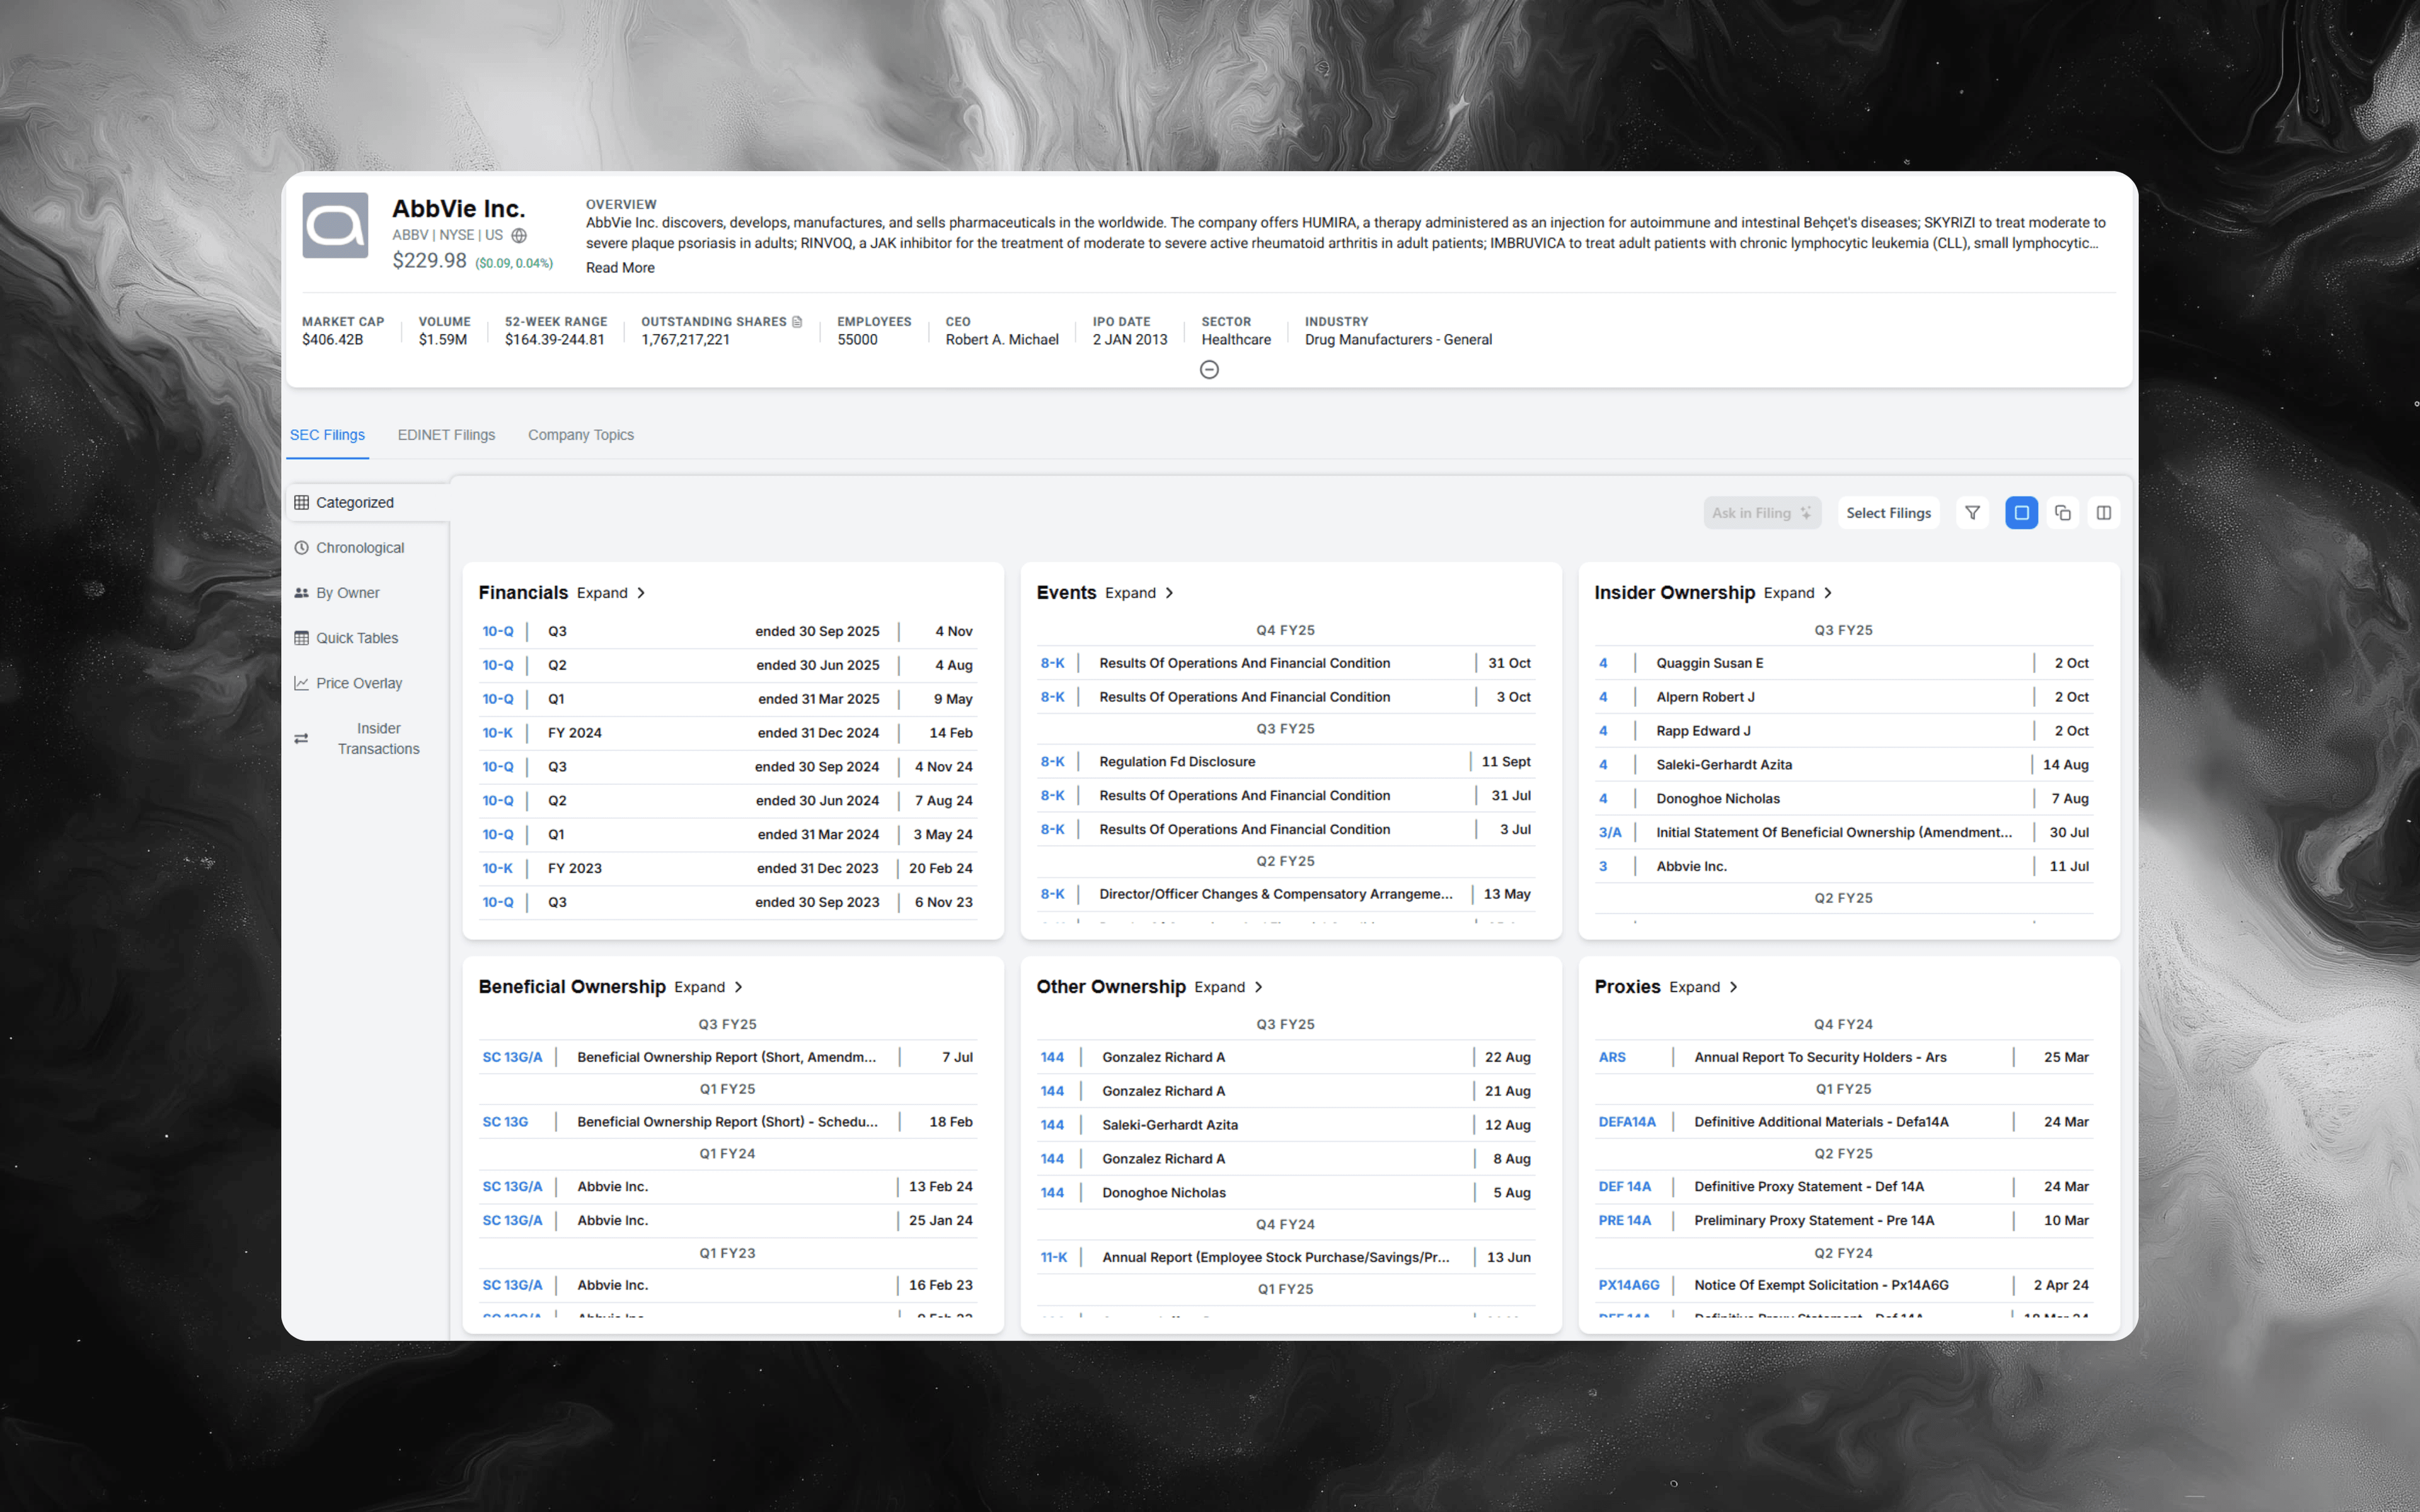
Table of contents
- The fastest mental model: AbbVie monetizes a portfolio of patented therapies
- How a prescription medicine turns into revenue (step-by-step)
- What AbbVie “sells” (and who the customer really is)
- The revenue drivers that matter most in biopharma
- Why margins can be high, and why they can compress quickly
- A quick checklist for reading ABBV filings like an analyst
- Explore AbbVie filings in Alpha Analyst
The fastest mental model: AbbVie monetizes a portfolio of patented therapies
A clean way to explain AbbVie to a non-specialist is:
AbbVie spends heavily to create (or acquire) medicines that treat serious conditions, then earns revenue during periods of patent and regulatory protection, while continuously trying to refresh the portfolio as older products face competition.
Two ideas make the model “click”:
-
Product concentration is common
A handful of therapies often drive a large share of revenue, which can boost profitability but increases dependence on clinical, regulatory, competitive, and exclusivity outcomes. -
The portfolio is always on a clock
Even a great drug faces eventual pricing pressure, biosimilar/generic entry, new mechanisms from competitors, or changes in payer coverage. That’s why you’ll see constant focus on pipeline progress and new indications.
This approach to revenue concentration and pipeline management is a shared challenge across the pharmaceutical industry, with Abbott and its peers all navigating exclusivity risks, competitive entry, and portfolio refresh cycles.
How a prescription medicine turns into revenue (step-by-step)
Here’s the practical lifecycle most biopharma companies operate under:
-
Discovery and preclinical work
Target selection, early compound screening, and initial safety work. High failure rates, long timelines. -
Clinical development
Human trials typically progress through multiple phases, with extensive regulatory oversight and large costs. -
Regulatory approval(s)
Approval is often indication-specific. Expanding into new indications can extend commercial value, but requires new trials and approvals. -
Manufacturing and supply chain
Biologics and complex therapies can require specialized manufacturing, quality systems, and redundant supply strategies. -
Commercialization and access
Revenue depends not just on physician adoption, but also on formulary placement, reimbursement, prior authorization rules, and contracting dynamics. -
Lifecycle management
New formulations, dosing regimens, combinations, delivery devices, or additional indications can extend a product’s relevance even as competition rises.
As an investor, the key is to read disclosures with this timeline in mind: the portfolio you see today was “funded” by decisions made years ago, and the next portfolio is being built right now.
To see how competitive pressure and changing sector trends affect manufacturing, contract strategy, and supply chains, review Manufacturing Trends 2025: 5 Signals to Monitor.
What AbbVie “sells” (and who the customer really is)
At the surface, AbbVie sells branded prescription medicines. But the “customer” picture is layered:
-
Patients and physicians influence demand
Clinical outcomes, safety profile, convenience, and guideline placement drive adoption. -
Payers and pharmacy benefit managers influence economics
Coverage terms, step edits, rebates/discounts, and utilization management can determine realized price and net sales. -
Wholesalers and distributors influence logistics
Channel structure affects timing, inventory dynamics, and sometimes disclosure complexity (for example, channel inventory levels can matter around major product transitions).
This is why biopharma filings tend to emphasize net sales mechanics, pricing/volume mix, and competitive dynamics rather than “units sold” alone.
The revenue drivers that matter most in biopharma
When you read ABBV, focus on the drivers that commonly explain most of the quarter-to-quarter and year-to-year story:
-
Volume, price, and mix
Growth can come from more patients, higher net realized price, share gains within a category, or geographic mix. Declines can come from competition, payer restrictions, and price pressure. -
Indication expansion
A therapy can grow materially if it moves earlier in the treatment pathway, expands into adjacent diseases, or gains new label claims. -
Competition and substitution
Small-molecule drugs often face generics; biologics can face biosimilars; both can face “next-gen” branded competitors. The mechanism of erosion differs, but the outcome is the same: pressure on price and/or share. -
Channel and contracting dynamics
Changes in rebate intensity, gross-to-net adjustments, and contracting strategy can change reported net revenues even if underlying prescription demand is stable. -
Pipeline timing
Approvals, trial readouts, and regulatory submissions are discrete events that can change the forward revenue curve quickly.
If you’re trying to build an “ABBV is a business” narrative in one sentence:
AbbVie’s revenue is the sum of its major therapies’ patient reach times net realized price, shaped by payer access and competition, with pipeline wins needed to offset inevitable declines in mature products.
Why margins can be high, and why they can compress quickly
Biopharma can look structurally attractive because successful drugs can scale with strong gross margins. But margin quality depends on what’s happening in the portfolio:
Ways margins can stay strong:
- High-value therapies with durable differentiation
- Efficient manufacturing at scale
- A portfolio mix tilted toward higher-margin categories
- Stable access terms (less rebate inflation)
Ways margins can compress:
- Intensifying competition (more rebates/discounts to defend share)
- Portfolio mix shifting toward lower-margin products
- Loss of exclusivity and rapid net price erosion
- Higher launch costs as new products ramp
- Manufacturing or quality events that raise costs or constrain supply
A practical analyst habit: when revenue surprises happen (positive or negative), immediately ask “was this volume, price, mix, or channel?” and “is this transient or structural?”
A quick checklist for reading ABBV filings like an analyst
Use this checklist to keep your AbbVie review consistent over time:
-
Map revenue concentration and dependencies
Identify how much of revenue is tied to the largest therapies and how management frames sustainability. -
Track exclusivity and competition language
Look for updates on timing, litigation posture, regulatory pathways, and competitive entrants. Even small wording changes can be informative. -
Separate volume from net price
When management discusses performance, note whether the driver is patient demand, access dynamics, or pricing/contracting. -
Watch R&D priorities and pipeline milestones
Pay attention to which programs are emphasized, what endpoints are used, and what timing is implied for readouts and submissions. -
Read risk factors for what changed, not what stayed
Risk factors are often long, but edits can signal emerging pressure points (regulatory, pricing, quality, supply chain, or litigation). -
Sanity-check the “portfolio refresh” narrative
Mature products typically face headwinds; confirm whether newer therapies are scaling fast enough (and how much is organic vs acquired).
In Alpha Analyst, a simple workflow is to build a saved keyword set you reuse each quarter (examples: “competition”, “biosimilar”, “exclusivity”, “rebate”, “gross-to-net”, “formulary”, “phase 3”, “submission”, “approval”, “risk factors”), then pin that saved search to a dashboard filtered to ABBV so you see what changed as soon as new filings arrive.
For a broader exploration of how analysts in adjacent sectors approach workflow, research strategies, and sector trends, see Day in the Life of an Investment Analyst: A Realistic Playbook.
Explore AbbVie filings in Alpha Analyst
To validate how AbbVie explains its portfolio strategy, understand what’s driving net sales, and monitor the disclosures most likely to shift your thesis, go straight to the primary-source filings: AbbVie Inc. (ABBV)
CTA: Use Alpha Analyst to search across ABBV filings with advanced keyword operators, save your best queries, and add them to a dashboard so new AbbVie disclosures surface immediately when they’re published.
Related Posts
View all posts →
January 31, 2026
Fed Chair Nomination News: What Hassett’s Comments Signal
A practical guide to tracking Fed leadership changes, confirmation risk, and market reactions using filings, search, and dashboards

January 29, 2026
New York Fiscal Crisis: A Company Impact Playbook
How to map NYC budget stress to revenue, taxes, real estate, and credit risk across US equities

January 29, 2026
Monetary Debasement and the US Dollar: A Company Playbook
What “currency going to hell” really means, what could come next for USD, and how US businesses can defend margins, cash flows, and valuation

January 16, 2026
Amgen (AMGN) Deep Dive: Products, Pipeline, and Key Risks
A practical equity-research playbook for underwriting the next leg of growth, margin durability, and biosimilar exposure

January 16, 2026
Daikin Industries (6367): A Deep-Dive Equity Research Playbook
Business model, segment drivers, key risks, and how to build a thesis faster in Alpha Analyst
Explore More
View all posts →
February 4, 2026
Software Stocks and AI Disruption Fears: Investor Playbook
How to evaluate “AI risk” claims, pressure-test seat-based pricing, and track what matters in filings using Alpha Analyst

February 4, 2026
Enphase (ENPH) Upgrade After Earnings: What Changed
A practical investor brief on the BMO upgrade, Q4 beat, 2026 guideposts, and how to track follow-through in Alpha Analyst

February 4, 2026
Tether fundraising report: what changed and how to track it
A practical framework for monitoring stablecoin issuer valuation, liquidity, and regulatory signals with Alpha Analyst